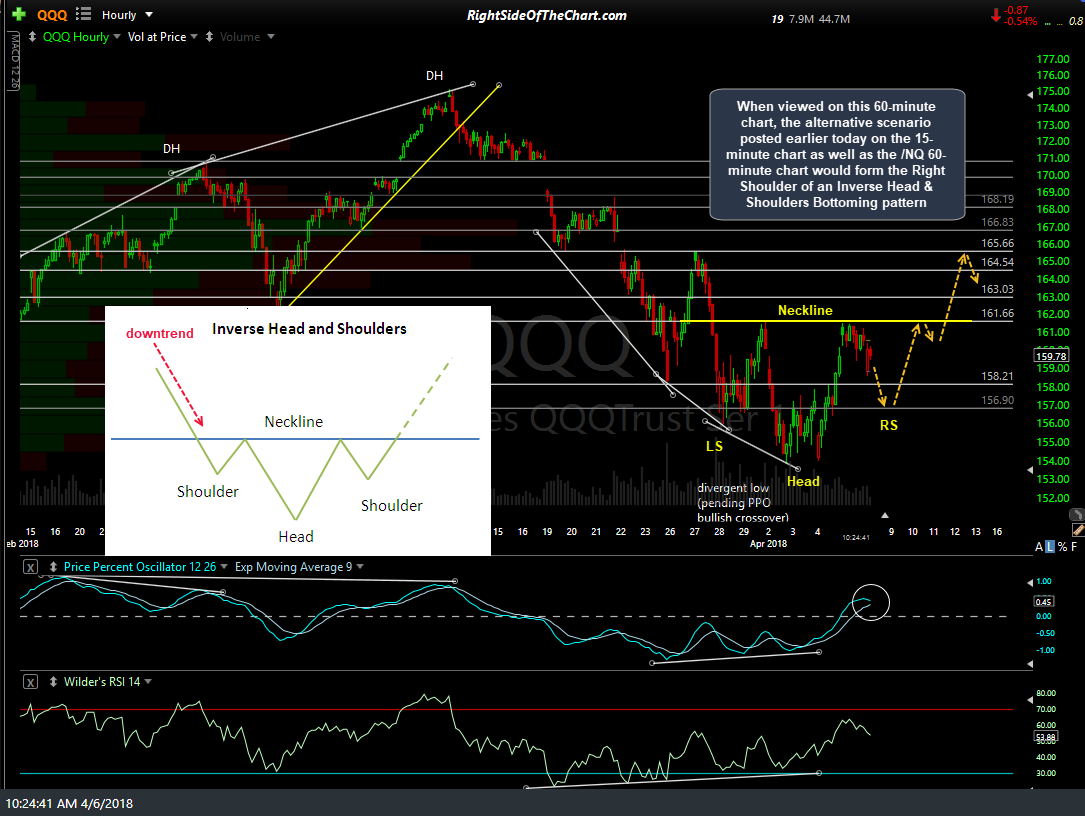
When viewed on this 60-minute chart, the alternative scenario posted earlier today on the 15-minute chart as well as the /NQ 60-minute chart would form the Right Shoulder of an Inverse Head & Shoulders Bottoming pattern. Based on the fact that the PPO on the 60-minute chart is starting to rollover off high levels, I am now closer to 50/50 on whether the primary scenario or this alternative scenario highlighted earlier plays out.
While I can’t guarantee that either scenario will play out, what I can say is that if QQQ does move impulsively lower from here down to the 156.90ish level, ideally on increased volume, it would offer an objective long entry or add-on there with a stop placed somewhat below. Should QQQ hit that level & reverse, forming a fairly symmetrical right shoulder, then the next objective long entry or buy signal would come on a break above the neckline.


