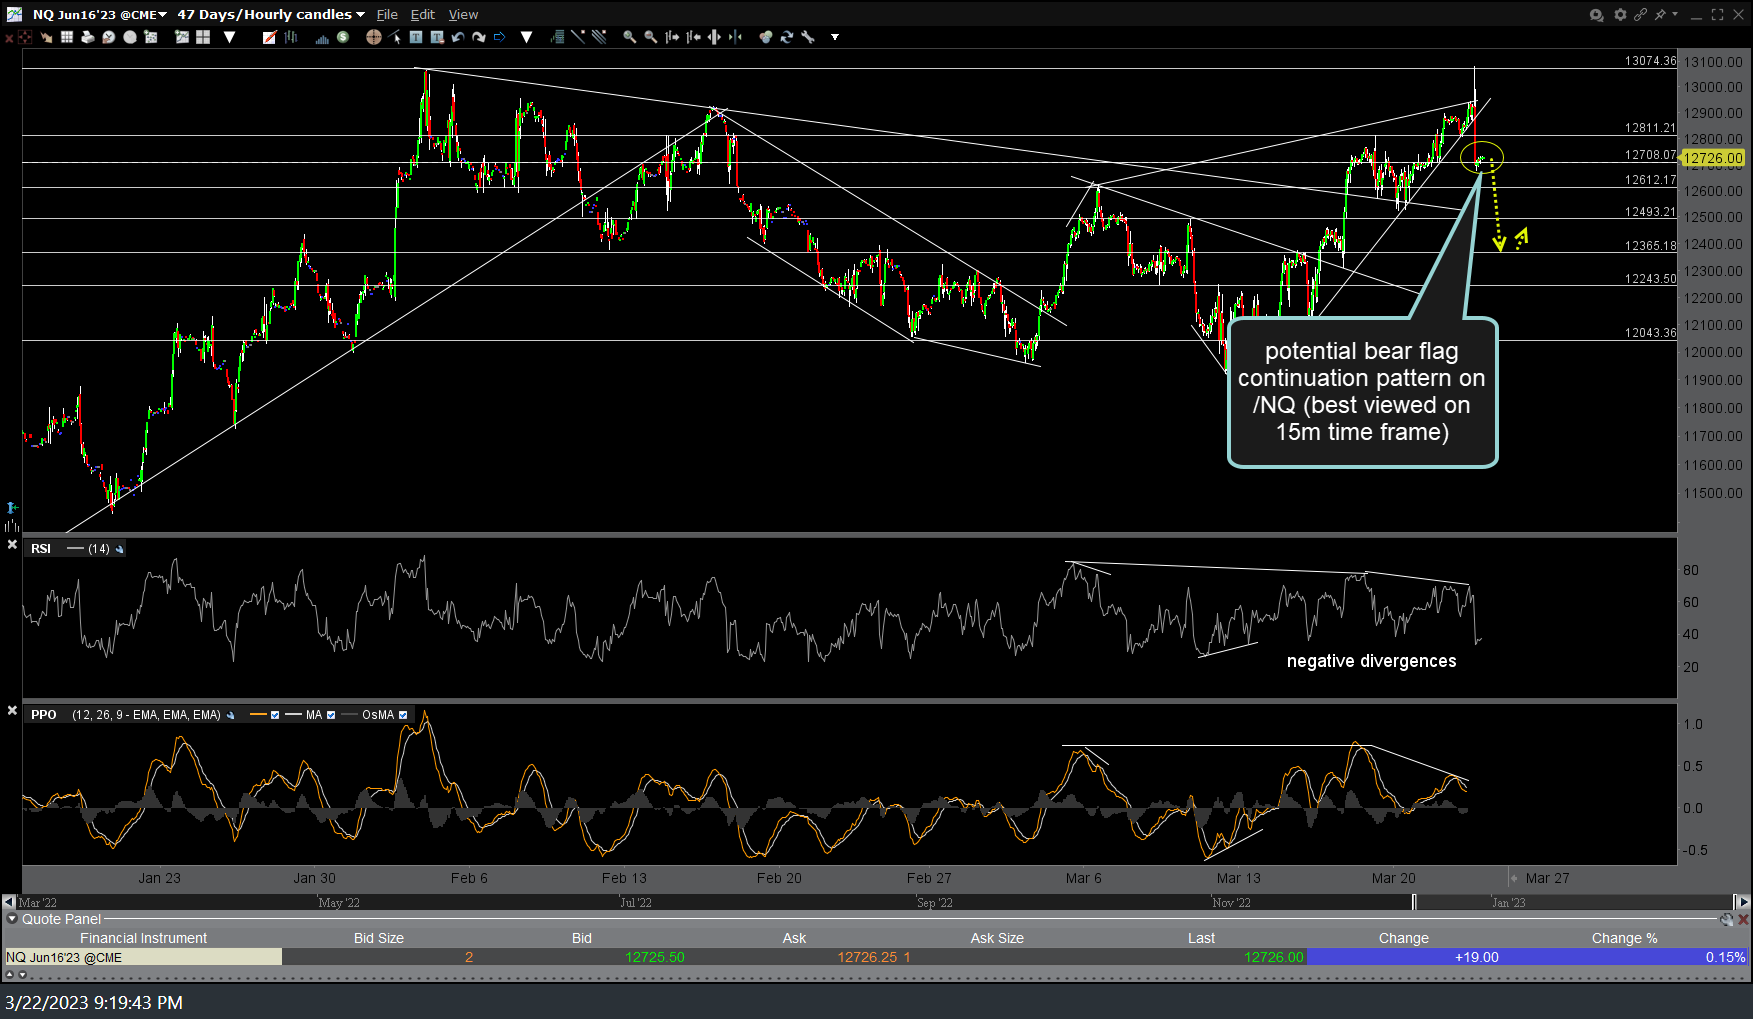
Following the late-session sell signal on QQQ & /NQ early today with the breakdown & impulsive drop below the 60-minute bearish rising wedge patterns, /NQ (Nasdaq 100 futures) appears to be forming what could prove to be a bear flag continuation pattern which is best viewed on the 15-minute chart. As with any bearish technical pattern, this is a trade setup with a sell signal to come on an impulsive break down below the flag.
Coincidentally or not, should this bear flag break down & play out to the measured price target of the pattern, which is the distance of the flagpole (impulsive leg down leading up to the formation of the flag) added to the top of the flag at the highest point just before it breaks down, that would take /NQ down to the around 12365ish support/target on the recently posted 60-minute chart, or maybe a hair below it to around 12350. First things first & that would be an impulsive break below the flag but just wanted to get this one out for those still trading on the West Coast or those burning the mid-night oil elsewhere. 60-minute & 15-minute charts above.


