
Member @consultlee requested an update on OSTK in the trading room. In my last update back on May 9th, (link required Gold level access to view) I had stated:
Nice bullish divergent low on the OSTK daily with a bullish engulfing candlestick today which offers an objective long on OSTK as a potential bottoming play. Even better if OSTK prints another green candle tomorrow (assuming today’s candle finalizes as a bullish engulfing stick). Also needs to take out the 13.80ish resistance which is just overhead as well so might be best to only take a starter position here & add if/when that happens.
From there, OSTK was unable to take out the 13.80ish R level with conviction after several failed attempts & continued lower while setting up in a bullish falling wedge pattern, reversing from there & finally going on to break out above the 13.80 resistance level, thereby triggering the next buy signal/add-on to the stock, rallying about 20% since that update (first chart below). So far, earlier today, the stock hit my first target of 16.18.
-
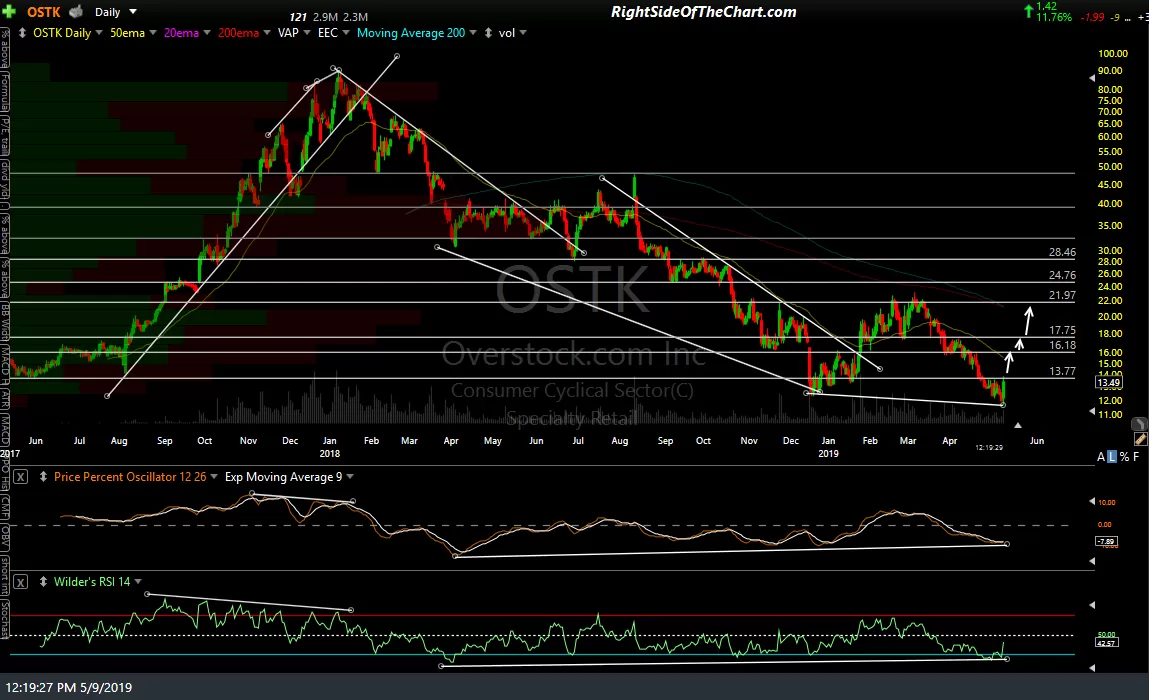
- OSTK daily May 9th
-
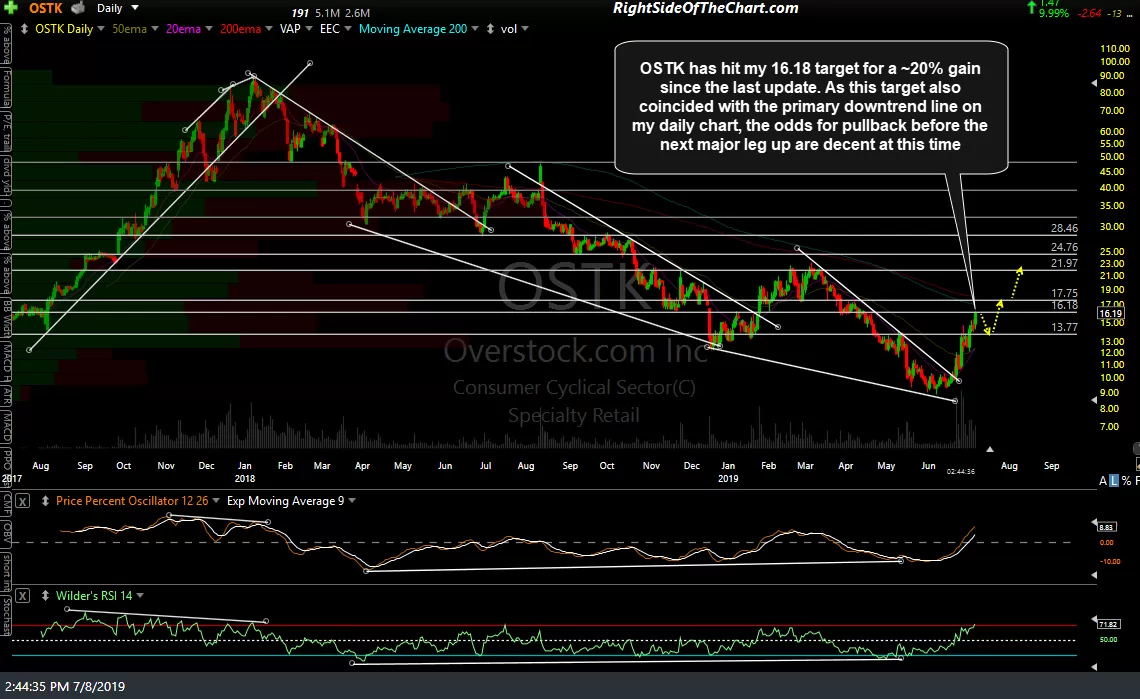
- OSTK daily July 8th
In my previous analysis also posted in the trading room back on April 24th, shortly before the stock bottomed after the brutal 90% bear market drop off the early January 2018 top in Overstock, I had stated:
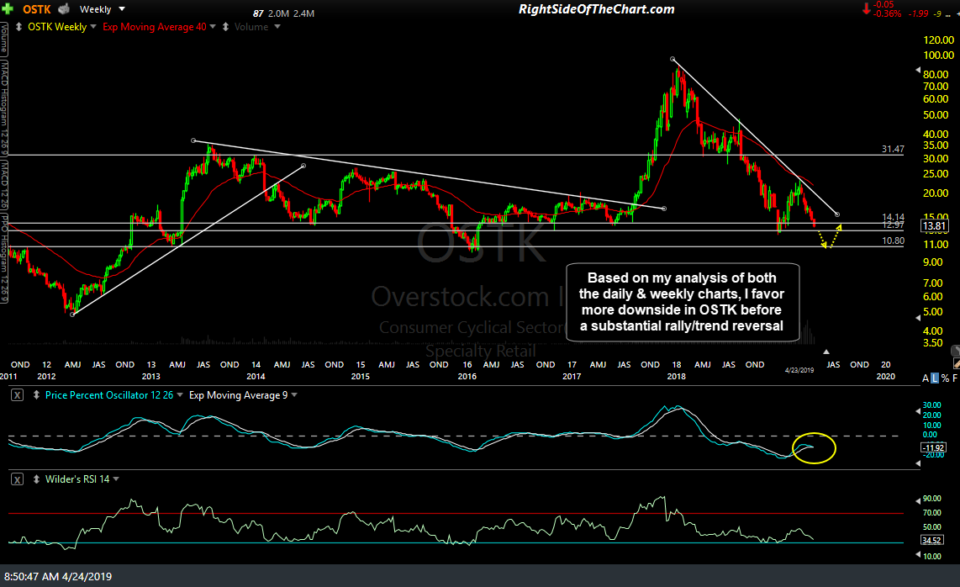
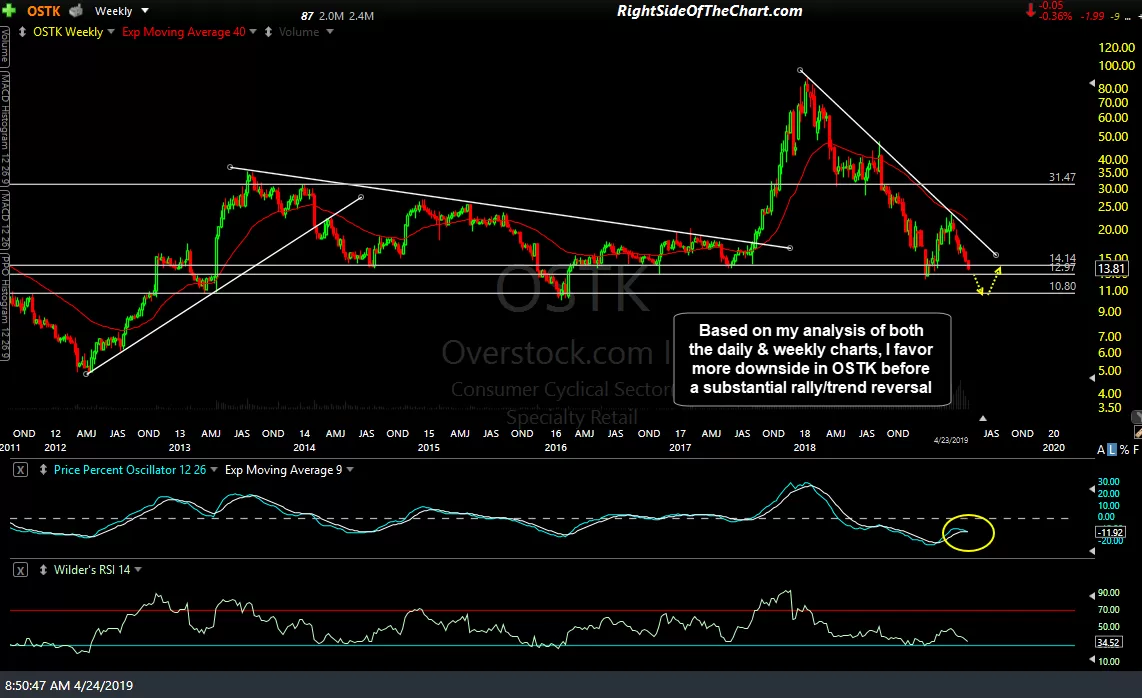
Based on my analysis of both the daily & weekly charts, (weekly chart below) I favor more downside in OSTK before a substantial rally/trend reversal although I (think) the R/R is not favorable to short the stock at this time nor can I make a case for an objective entry, long or short. Feel free to bump me for an update on OSTK in a few weeks.
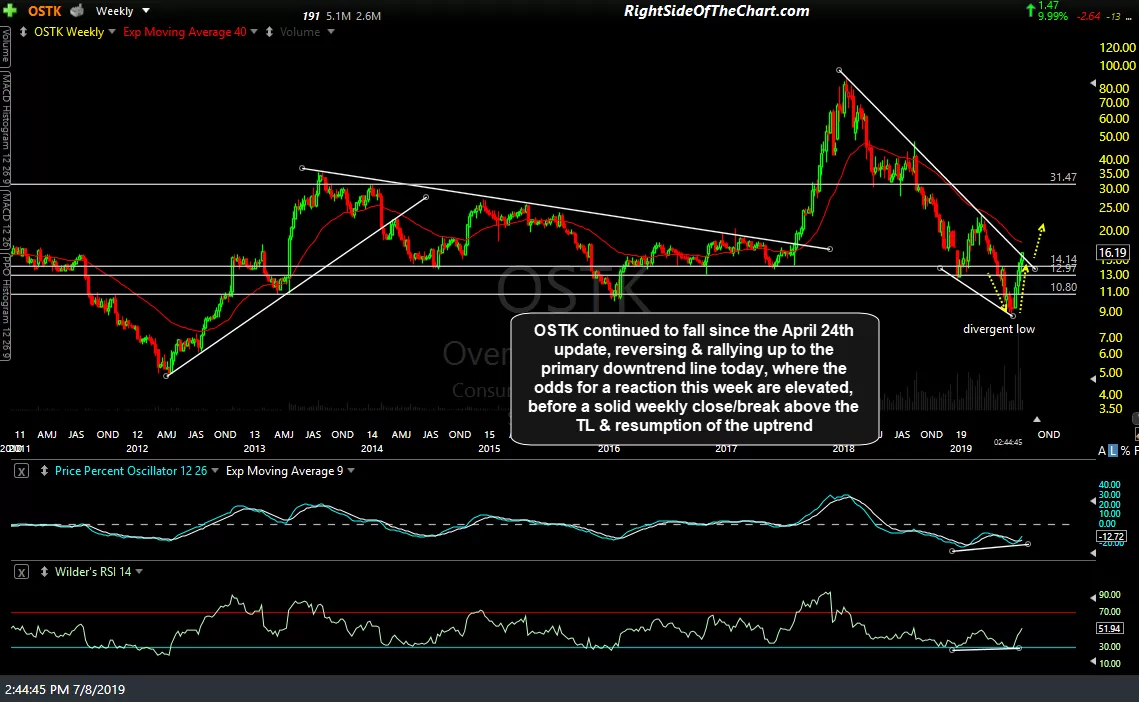
From there, the stock continued to fall another 35% before putting in the divergent low & bullish falling wedge pattern, which it broke out above shortly afterward. In that April 24th update (first chart below), my preferred scenario had OSTK continuing down to the 10.80ish support level, which it ended up doing along with a brief momentum-fueled overshoot of that level, followed by a reversal & rally up to the weekly downtrend line, which has now been hit today (second, updated chart below).
-
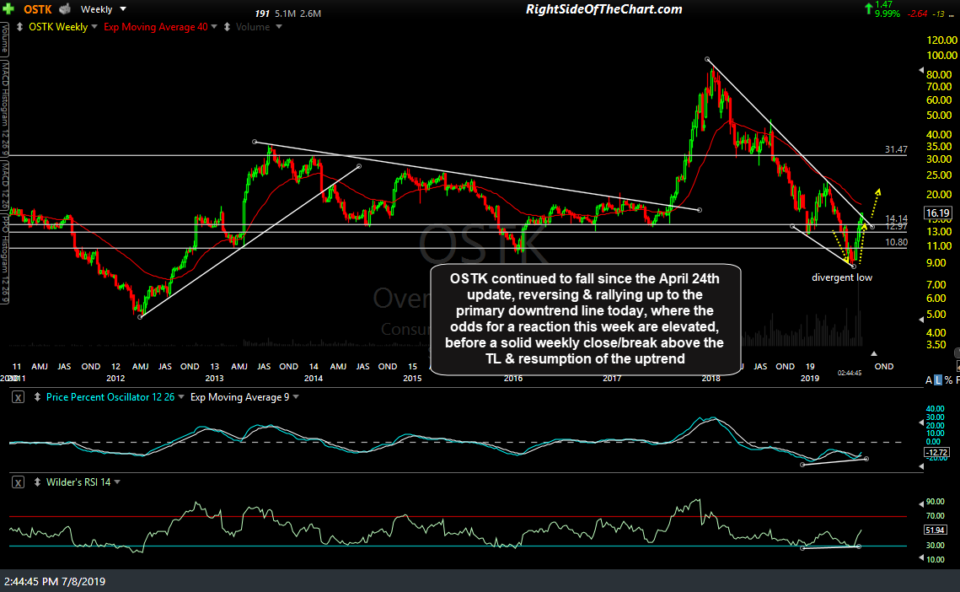
- OSTK weekly July 8th
-
- OSTK weekly April 23rd close
Based on the fact Overstock.com is has rallied into resistance while overbought on the daily timeframe and more importantly, has rallied into the primary downtrend line (resistance), the odds for a reaction off this initial tag of the downtrend line today or later this week are elevated at this time. With the current uptrend very strong, I have no desire to try to game a pullback by shorting the stock but I do think it is worth monitoring the stock for the next objective long entry, ideally after a pullback and/or consolidation off/below this trendline followed by an impulsive break above to trigger the next buy signal. This would also be a good time for those long to either book partial or full profits and/or raise stops to protect gains.