
With today being OpEx (standard options expiration which is the 3rd Friday of every month), it is worth mentioning that the odds favor a selloff starting next week. The dashed red lines on this daily chart of QQQ show OpEx dates with the yellow & white arrows showing a pattern of market ramps (yellow arrows) into OpEx, followed by fades (white arrows) the following week. Filters should be applied as when to expect or not expect a post OpEx sell-off, such as periods following correction or any months that the market did not rally into OpEx, especially when the market sold down in the days leading up to Options Expiration.
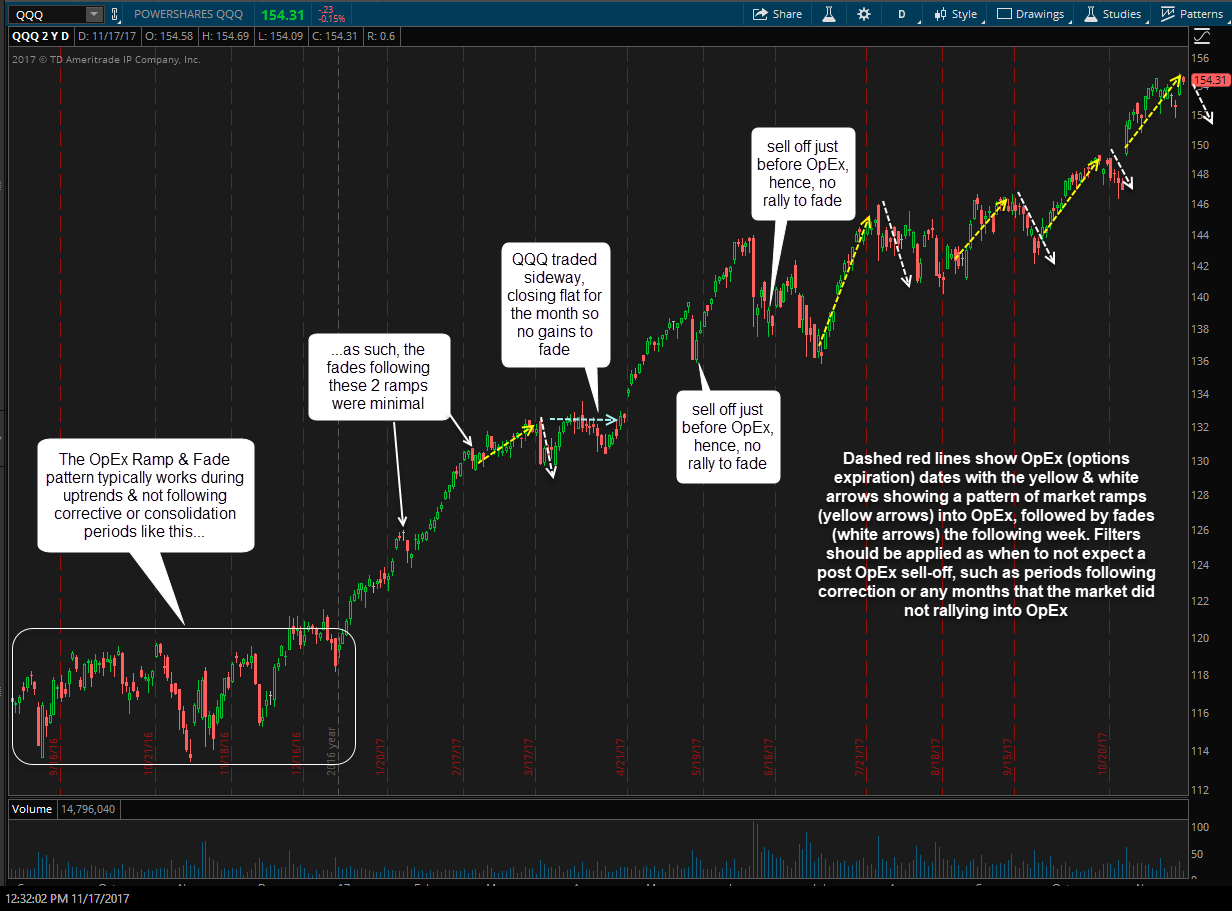
QQQ OpEx Ramps Nov 17th
While this pattern has played out more often than not* in recent years (*when the aforementioned filters are applied), like anything else in technical analysis, it does not work 100% of the time & as always, is best used not as a standalone sell signal but rather in conjunction with other confirming (or contradicting) technicals. At this time, a case for a reversal can still be made on QQQ & SPY based on the recently highlighted developments on the 60-minute charts although any significant upside from current level will start to rapidly erode the bearish case. As such, the price action over the next week should give us a better clue as to the next near-term (3%+) direction in the US equity markets.