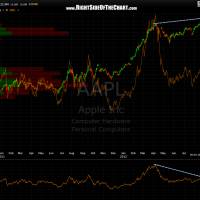
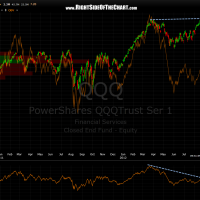
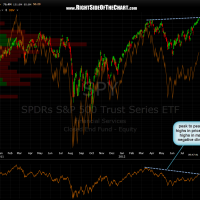
Here’s daily charts SPY, QQQ and the Lead Dog (AAPL) with the On Balance Volume (OBV) overlaid with prices as well as shown separately below. OBV has significantly lagged behind price since the market top back in early April, as illustrated in the OBV vs. price overlay and now that the SPY, QQQ, and AAPL have all made new highs, we also have confirmed the significant negative divergence (with higher highs in the markets & AAPL vs. lower highs on their respective OBV indicators). As with everything else, this does not mean that the market can’t or won’t go higher but it does add yet another red flag to a growing list of many.
Here’s an great description on OBV from the chart school at stockcharts.com.
Nothing much has changed on my thoughts on the markets. Stock prices are up very sharply since the June 4th lows in spite of a clear trend of deteriorating macro-economic fundamentals, both abroad but more importantly in the US. I still believe that a substantial mean reversion will take place over the next few months with one of three likely scenarios, in descending order of probability:
- Stock prices will soon make a sharp correction as new economic data continues to deteriorate going forward (the trend that is, irrespective of temporary blips & fictional seasonal adjustments).
- Stock prices will either stall or modestly retract while US economic data shows an overall trend of stabilization to slight improvement (this scenario would likely be marked by both choppy equity prices and economic data but the markets likely trading within a range between the June 4th lows to at or just above current levels).
- US economic data will begin to improve at an accelerated rate, justifying the current equity rally and opening the door to additional gains going forward (with the usual minor counter-trend corrections along the way).


