As stated in recent videos, I’ve continued to see more & more of the “check marks” or sell signals that I’ve been expecting & waiting for over the past month or so: Breakdowns below my key yellow support levels on the majority (and as of this week, all) of the top sectors in the S&P 500; 10-yr Treasury bond falling into my ‘orange’ zone on rising yields; crude oil spiking into its comparable ‘orange’ zone as well, further fueling inflation & continuing to whack down market expectations for rate cuts this year; etc, etc, etc…
However, the last holdouts of the remaining “check marks” are the remaining market-leading & top-heavy components of the indexes in the every-shrinking group of stocks FKA the Magnificent 7. With TSLA & APPL long since getting booted out of that elite club, that just leaves a handful (MSFT, NVDA, GOOGL, AMZN, & META) although I suspect it will only take just one of those remaining elites to roll over with the rest of the lot likely following suit shortly afterward.
NVDA (NVIDIA), the poster-child for all-things AI, which has arguably been one of, it not the largest driving force from a demand/buying perspective for the other mega tech stocks, namely GOOGL & MSFT (albeit, FAR from profit/earning boost as those companies are spending massive amounts of capital with little to no return on their AI investment & no guarantee if or how effective they will be in monetizing their AI services anytime in the foreseeable future), will likely bring the stock market down in the same manner it led it up in 2023 & Q1 ’24.
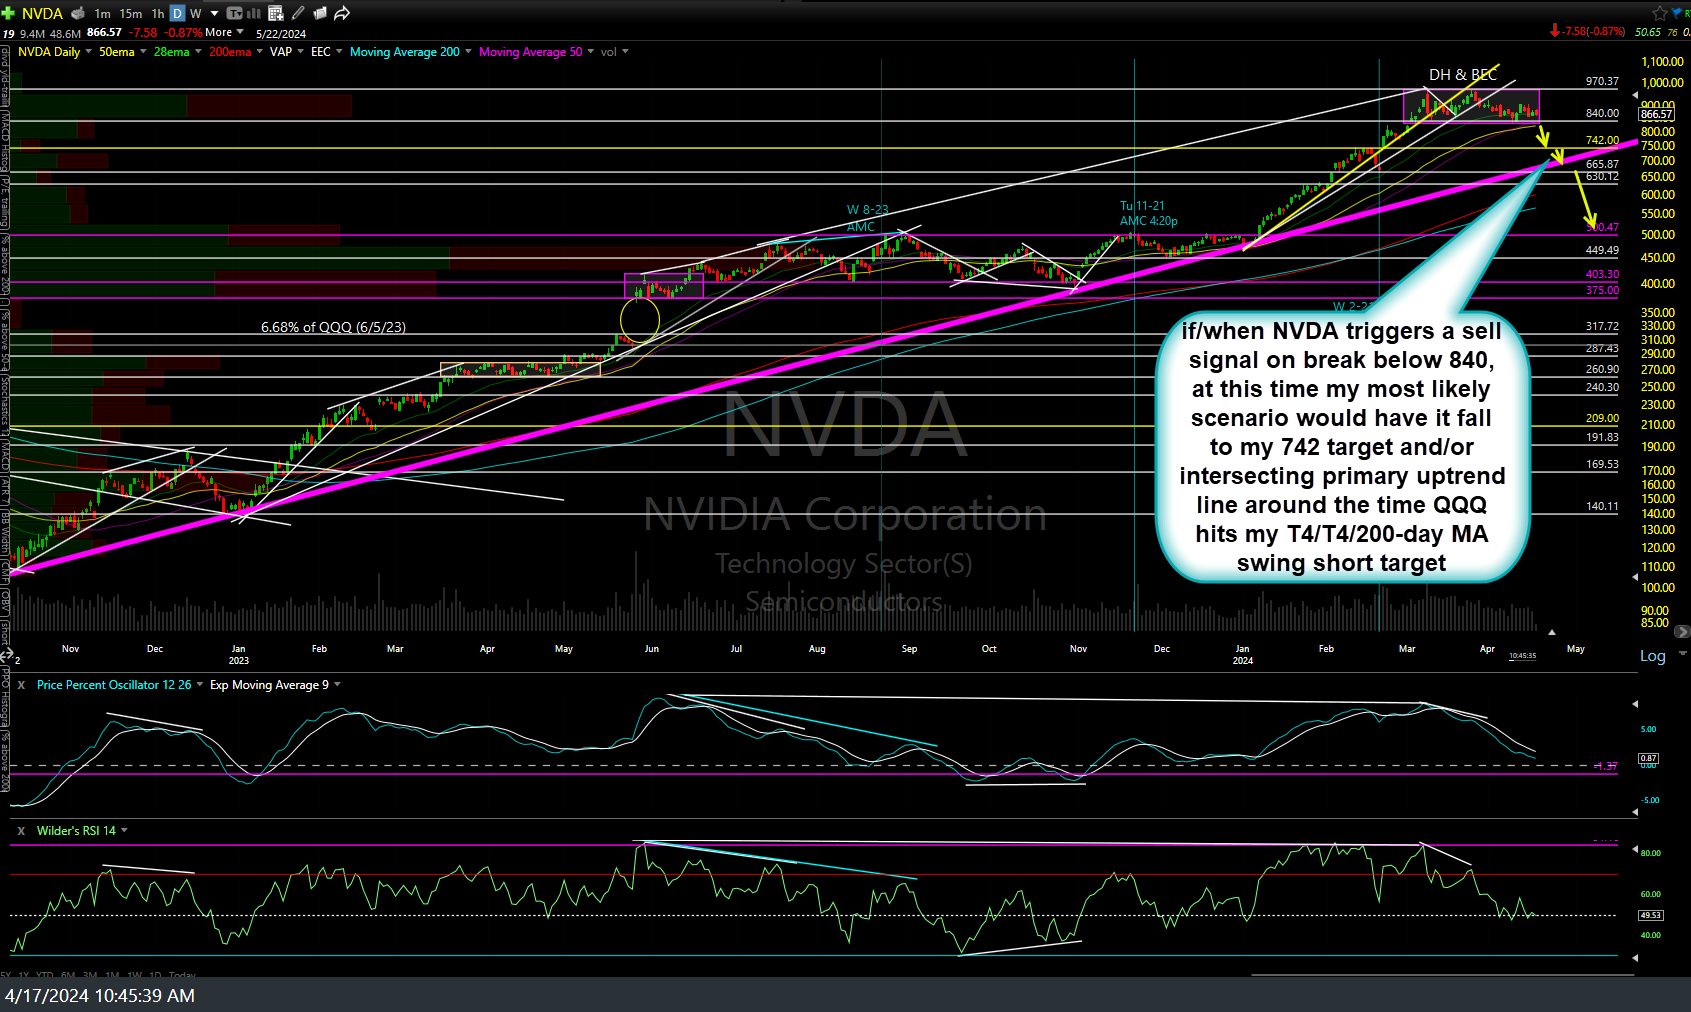
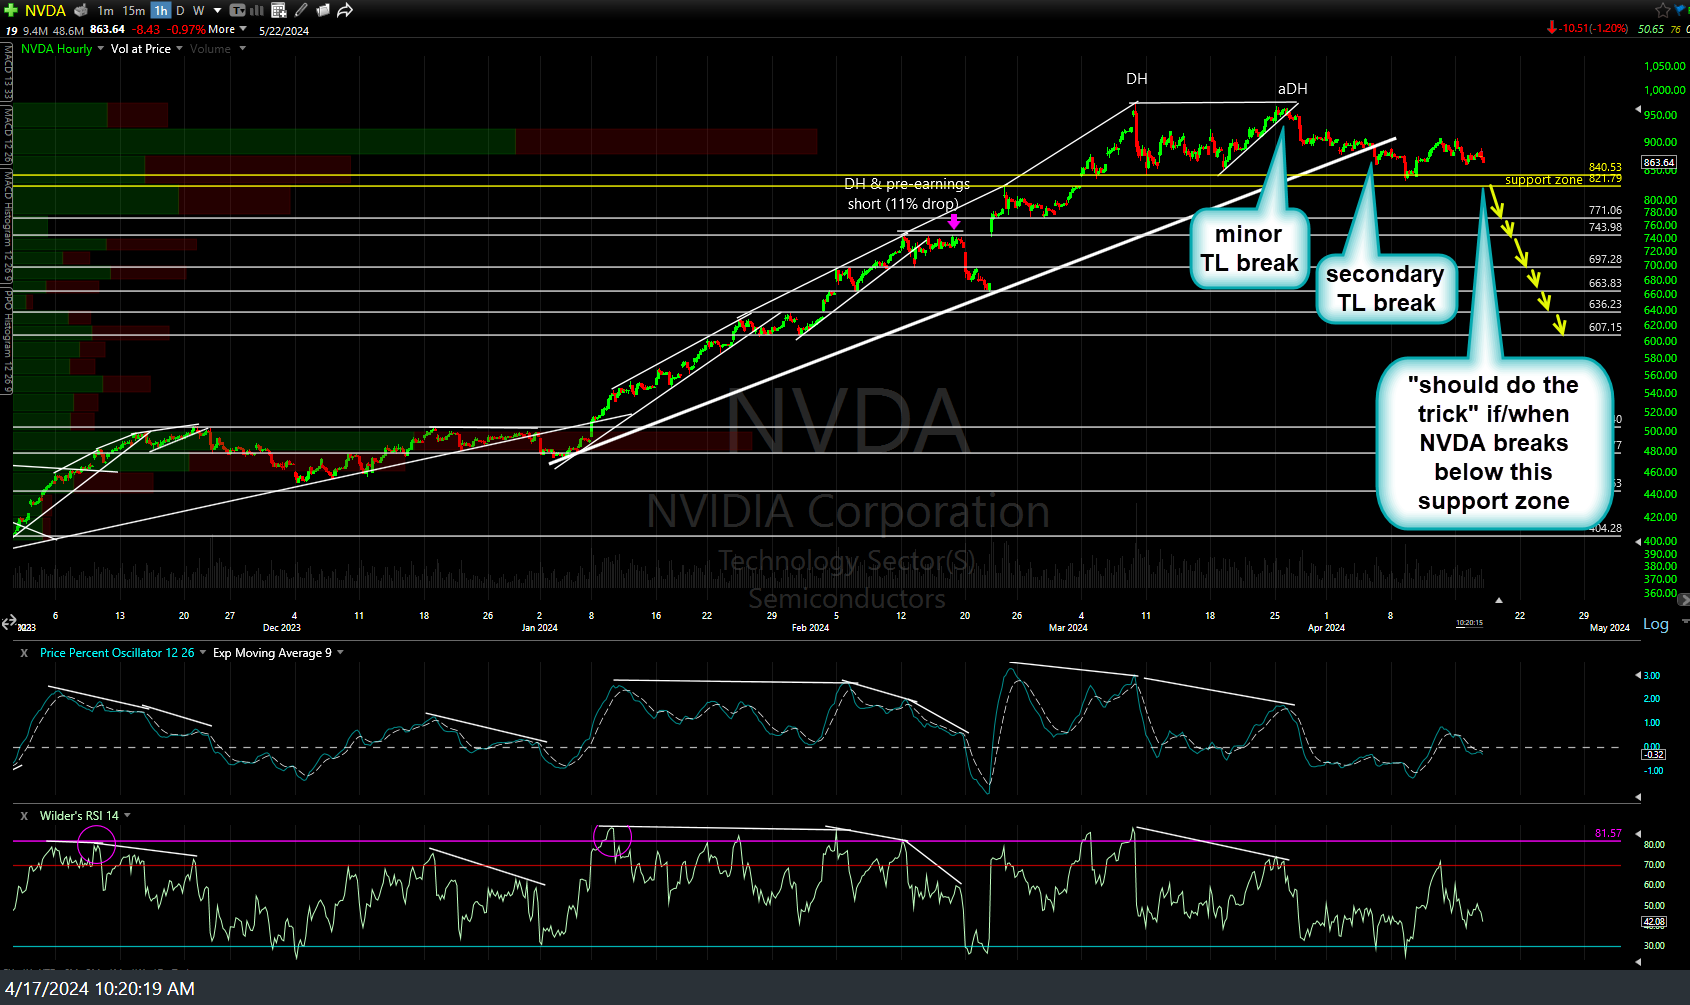
Again, that’s an IFTT scenario (if this then that), meaning FIRST, NVDA needs to trigger a half-decent sell signal & THEN, the stock needs to fall to at least some of the initial swing targets on the daily time frame that I’ve been highlighting recent. Those targets are indicated by the arrow breaks on the daily chart above while the level that I “think” will do the trick to kick off that correction will be a break below the 840-820ish support zone on this 60-minute chart below. Arrow breaks on the 60m also denote “micro” levels that might produce reactions for active swing traders looking to game bounces off support (as well as for those bullish looking for objective dip levels to buy).
If/when NVDA triggers a sell signal on break below 840 (daily chart), at this time my most likely scenario would have it fall to my 742 target and/or intersecting primary uptrend line around the time QQQ hits my T3/T4/200-day MA swing short target. Again, no sell signal, no chance of those targets getting hit although it does appear to me that if & when this over-hyped, over-loved, over-owned tech stock finally rolls over, the rest of the stock market will follow so much that I would put very high odds that MSFT, GOOGL, & AMZN will take out their comparable yellow key supports shortly after (or just before) NVDA breaks down.


