The NSL long is somewhat unique amongst the closed end funds recently added to the new Growth & Income Trade ideas category. Like the other CEFs, the Nuveen Senior Income Fund was selling at a substantial discount to NAV at the time of the original post (about 7% then vs. about a 3% discount to NAV today, as the price increase over the last month or so was largely attributed to the expected reversion back toward par). However, what makes NSL unique from those as well as most other income producing closed end funds are the type of securities that it holds. The fund invests at least 80% of its managed assets in adjustable rate senior secured loans. Up to 20% may include U.S. dollar denominated senior loans of non-U.S. borrowers, senior loans that are not secured, other debt securities, and equity securities and warrants. The fund uses leverage to enhance returns, which as we all know, can cut both ways (this can be evidenced by a quick glance at the plunge in NSL’s share price during the 2007-2009 bear market as a result of the systemic deleveraging).
My take on the 17% drop in the fund from it’s March 1, 2013 peak to the Sept 23rd lows was that it was due in large part to the Rush for the Exits as one of the largest bubbles in recent years began the unwinding process. The Rush for the Exits being the unwinding of bond and high-yielding dividend stocks once it became clear that the Fed would soon focus on tapering it’s bond purchases. For the most part, there are two primary factors effecting the NAV of the Nuveen Senior Income Fund: The economy and interest rates. Regarding the latter, unlike typical fixed-rate securities such as most bonds and preferred stocks, rising interest rates do not have negative impact the value of NSL’s holdings as the rates on those loans are periodically adjusted up or down with rates (such as LIBOR or whatever benchmark the rate on each loan is tied to). Regarding the former, although the majority of these loans are secured, the vast percentage of these loans are made to companies with credit rating below investment grade. In other words, NSL is comparable to a junk-bond fund with the primary difference being that the loans are shorter-term and are required to pay adjustable vs. fixed rates of interest. In fact, only about 6 1/2% of the loans currently held by NSL are rated as investment grade (AAA-BBB) while the remainder are rated BB-CCC (aka- “junk”) or unrated (typically junk as well).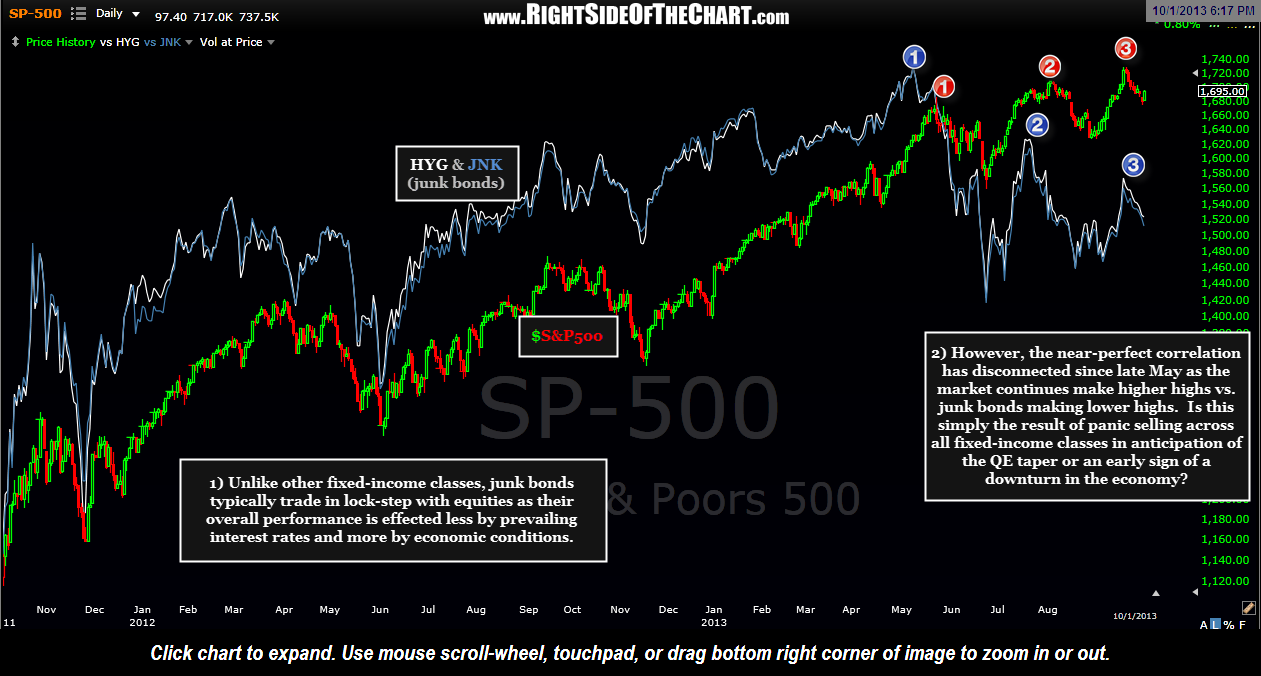
Junk bonds, as well as “junk loans”, tend to trade more inline with the business cycle (economic expansion/contraction) than regular fixed-rate bonds or loans. This is due largely to the fact that when economic conditions are favorable, business is good and these companies are able to make whole on their interest & principal payments. Once the business cycle turns and the economy begins to contract, the default rate on junk securities will usually rise inline with the severity of the contraction (which leads to sharp and often total declines in the value of the bonds/loans). This is probably more than most care to know about investing into low-quality, high-yielding investment but I figure that it is worth mentioning since I employ the use of both technical and fundamental analysis in my trading, especially on the longer-term trade ideals such as NSL. Although junk bonds are currently signaling some potential warnings signs for the economy as such ETFs as JNK & HYG are severely lagging US equity markets (see chart above), there is the likelihood that the underperformance in both junk bonds as well as adjustable rate loans funds such as NSL were simply victims of the whole “baby was thrown out with the bathwater” panic selling that hit just about all high (and even not so high) yielding stocks and bonds. This selling was the result of investors in a very crowded trade tripping over each other to get out once it finally sank in that they had virtually zero upside capital appreciation potential in bonds with virtually unlimited downside… all for the sake of chasing after an extra few percentage points in yield (which of course was wiped out many times over due to loss of principal in just the past several months).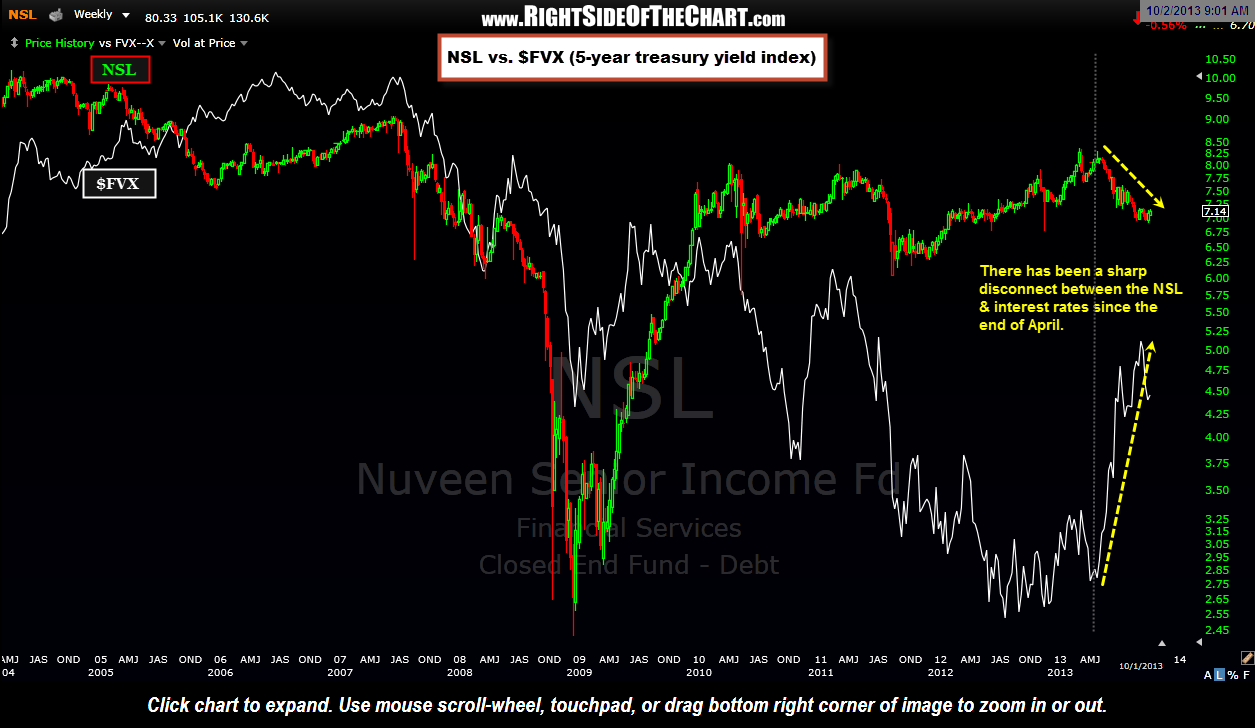
OK, a long explanation including two possible (although not necessarily mutually exclusive) explanations for the sharp decline in NSL and junk bonds over the last 4 or so months. However, that is my segue into this next chart which shows an even more powerful disconnect that that of stocks and junk bonds. The chart above plots NSL against $FVX (5-year treasury yield index). This chart spans over the last decade and shows a very high correlation between interest rates and share price of NSL. When rates were rising, NSL was moving higher in price as unlike fixed-rate securities, the rates on it’s holding were increased as well and vice versa when rates fell. However, notice the very sharp disconnect, a very strong inverse correlation, between the two since NSL peaked in late April of this year. Given, there are some major distortions in the financial markets due to quantitative easing by the Fed but even then, I would expect at least a half-decent reversion to the mean on following such a disconnect between NSL and interest rates. Maybe that disconnect comes in the form of a sharp move back down in rates while NSL holds around current levels but my current take is that the sharp decline in NSL since late April was largely attributed to indiscriminate, mass selling of just about any high yielding investments. If so, and assuming that rates continue to move higher or at the very least, only experience at relatively shallow and short-lived correction from current levels (my preferred scenario), then from a fundamental perspective, NSL could benefit from playing game of “catch-up” to the surge in rates over the last 4-5 months as the rates on the loans within their portfolio are reset higher.
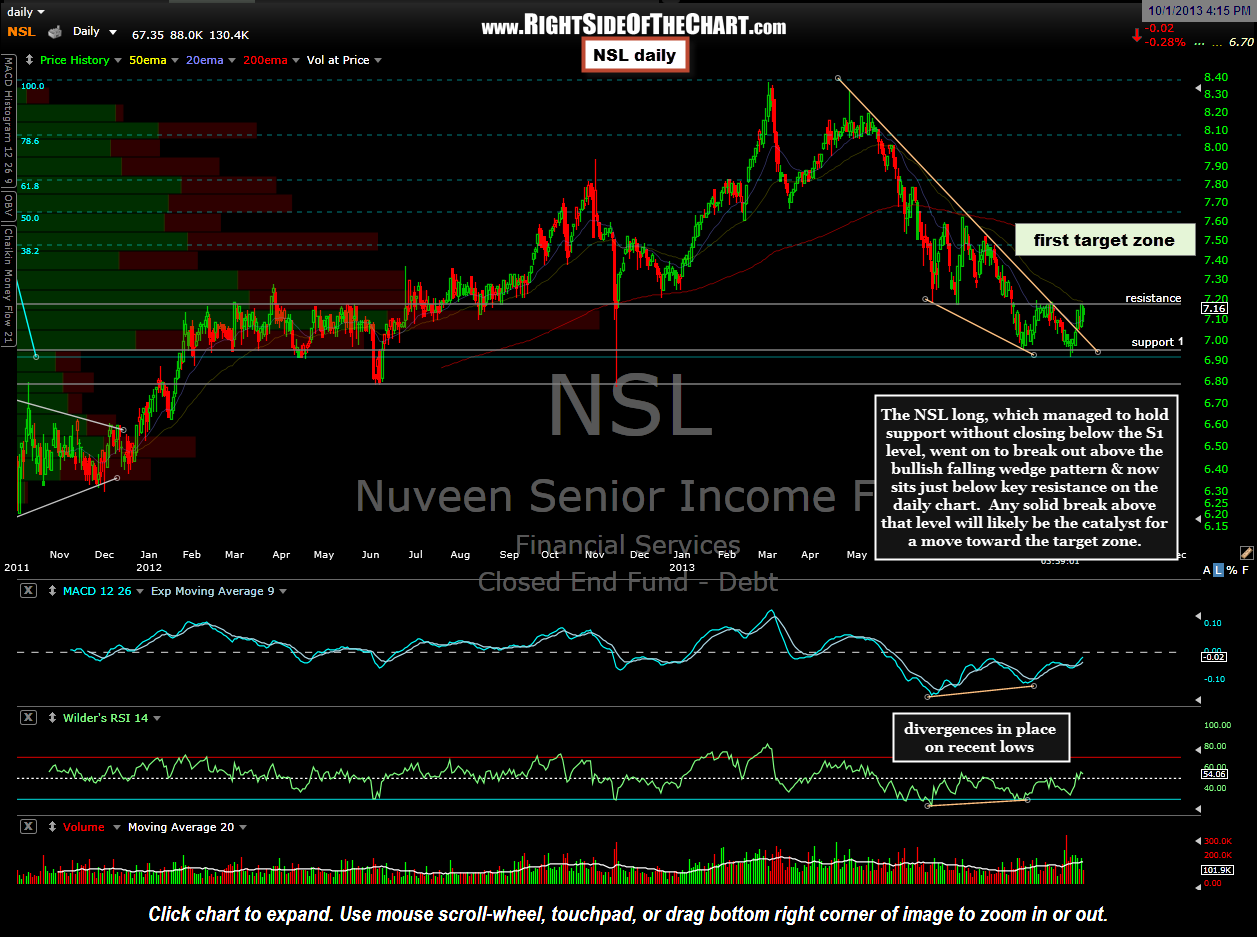
Finally that brings us to the updated daily chart of NSL. Since the original entry for the NSL Growth & Income Trade Idea was posted on Aug 27th, NSL pushed higher for one last tag of the top of the bullish falling wedge pattern before pulling back and then impulsively (on strong volume) breaking out above the pattern. As mentioned before, solid positive divergence were in place at the bottom of the wedge which would indicate that NSL has quite a bit more upside left over time. Currently the CEF is up against as significant resistance zone and may or may not need some consolidation before taking that level out. As I am partial to a near-term pullback in rates, I am leaning towards a pullback and/or consolidation that may last several weeks but whether or not that happens, the next buy signal will be triggered on a solid break above this resistance level. I have yet to identify an exact target but currently I’m eyeing the target zone listed on this updated daily chart below.