
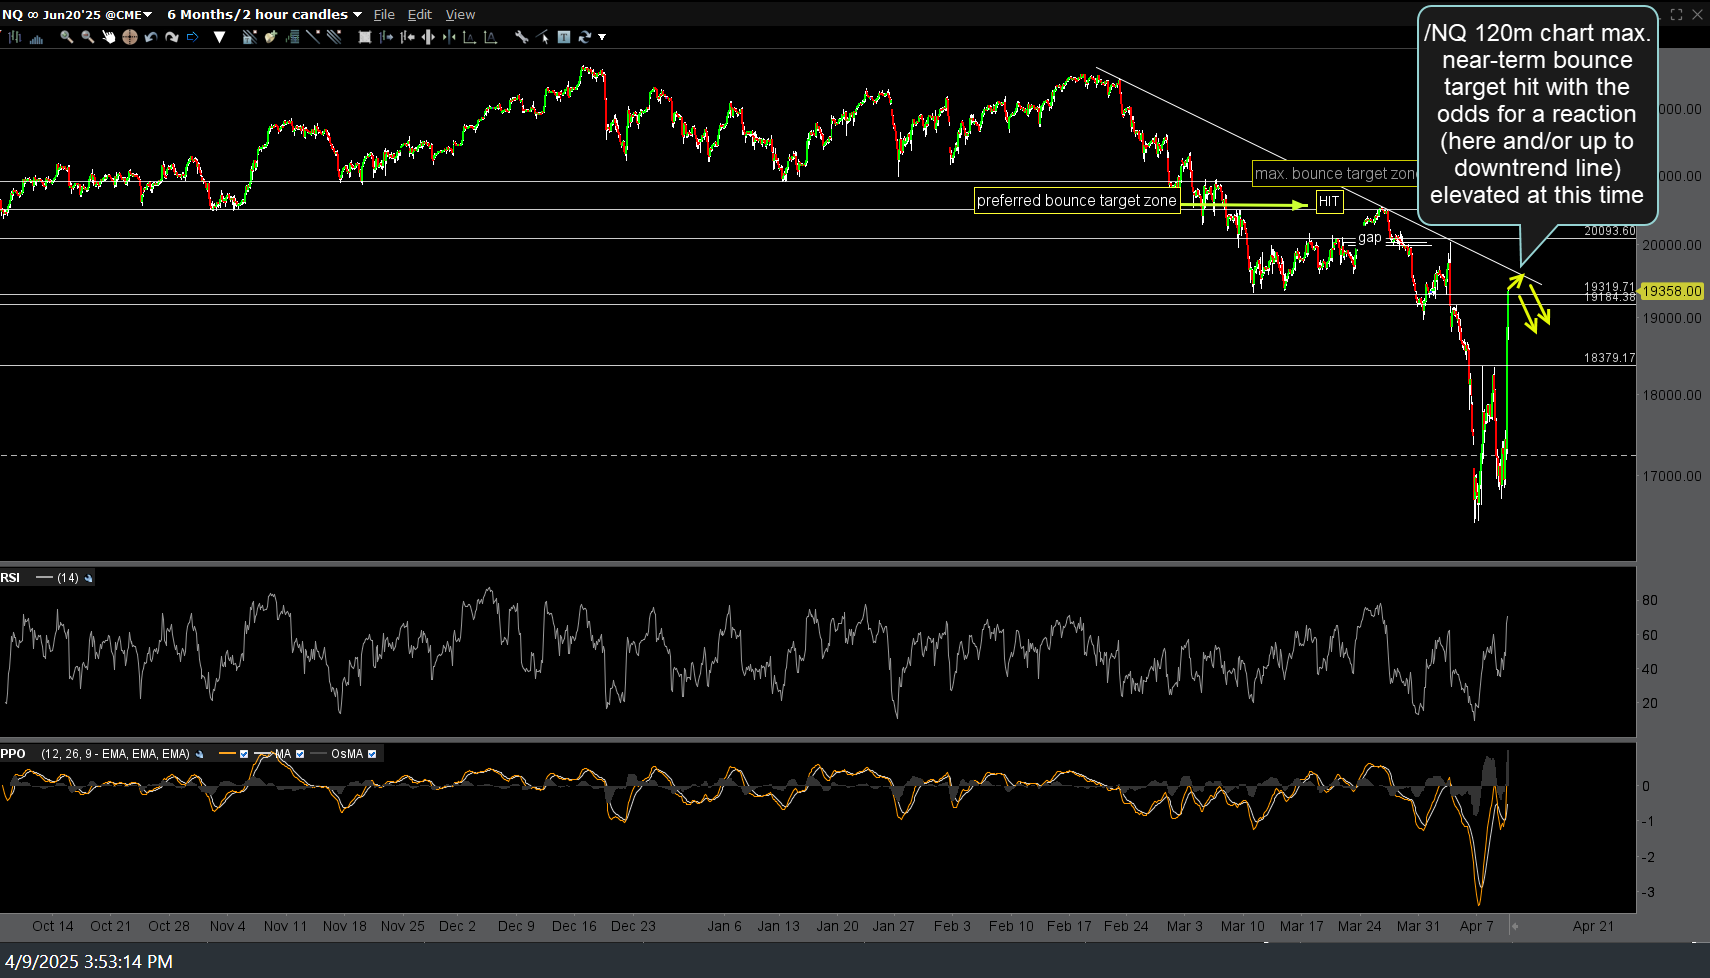
/NQ (Nasdaq 100 futures) is currently poised to start the day at the primary downtrend line just shy of the bottom of the 19804-19374 resistance zone at which several profitable reversal (long to short) points have been highlighted in recent weeks, including yesterday. /NQ is also testing the top of the recently highlighted symmetrical triangle pattern, with a definitive break above the top or below the bottom of the triangle likely to determine the next tradable trend in the market. Previous (since April 9th) & updated 120-minute minute charts below.
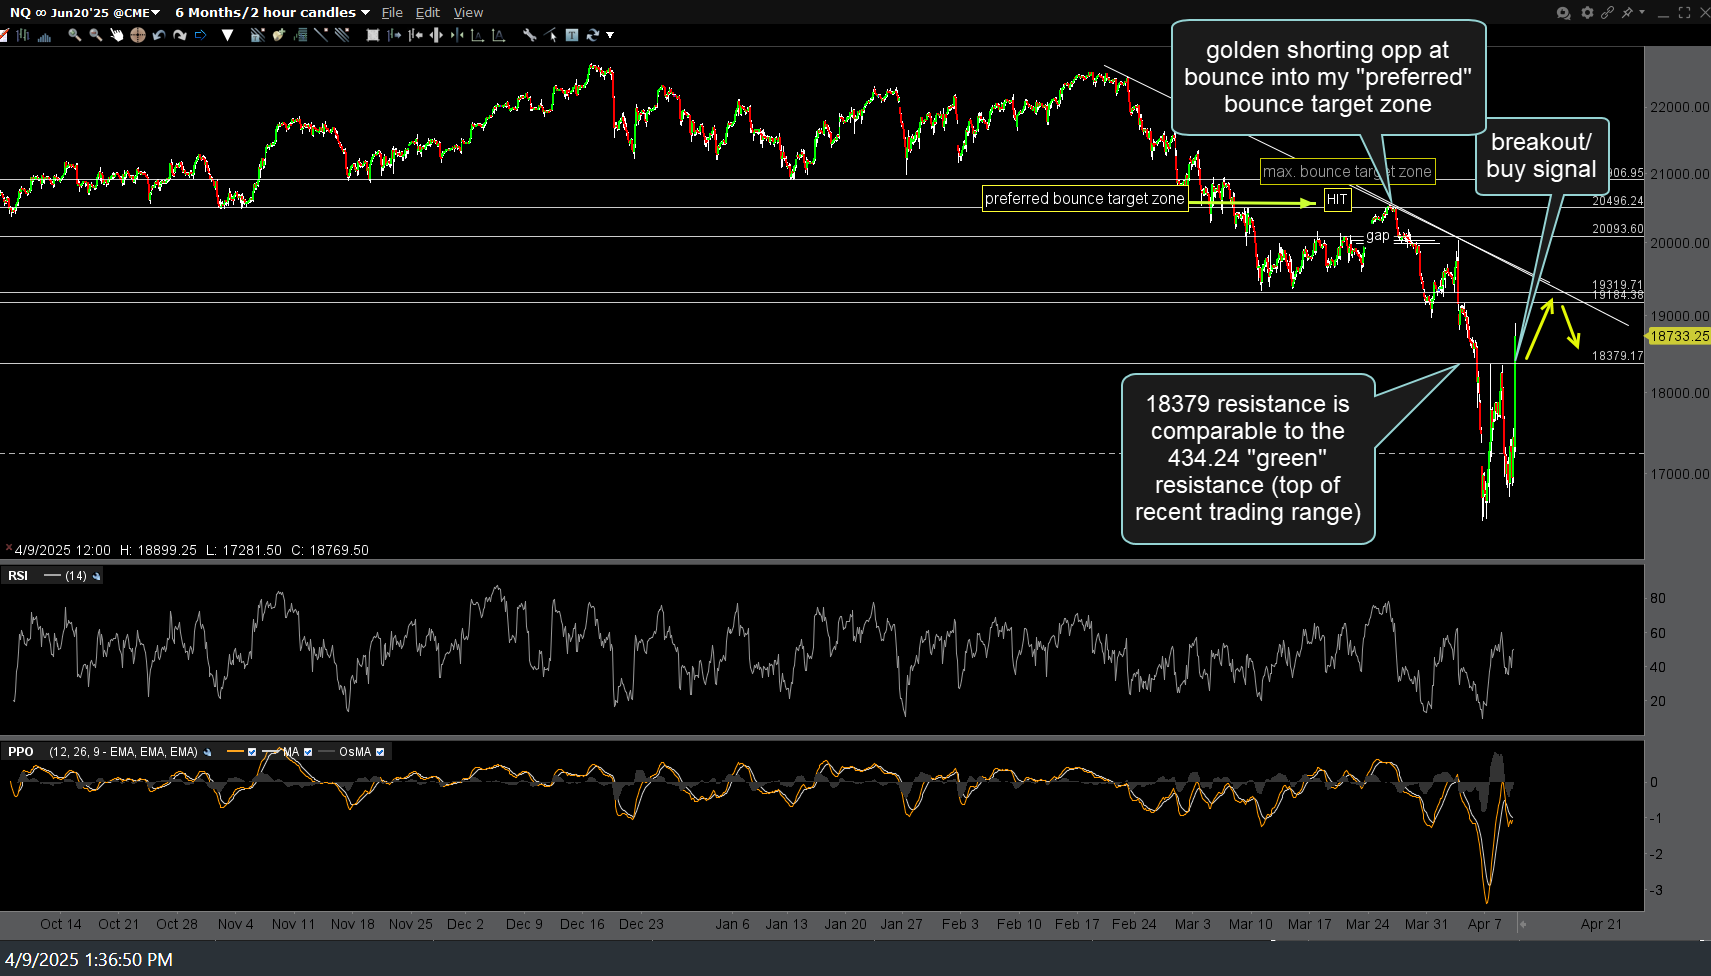
NQ 120m April 9th
NQ 120m 2 April 9th
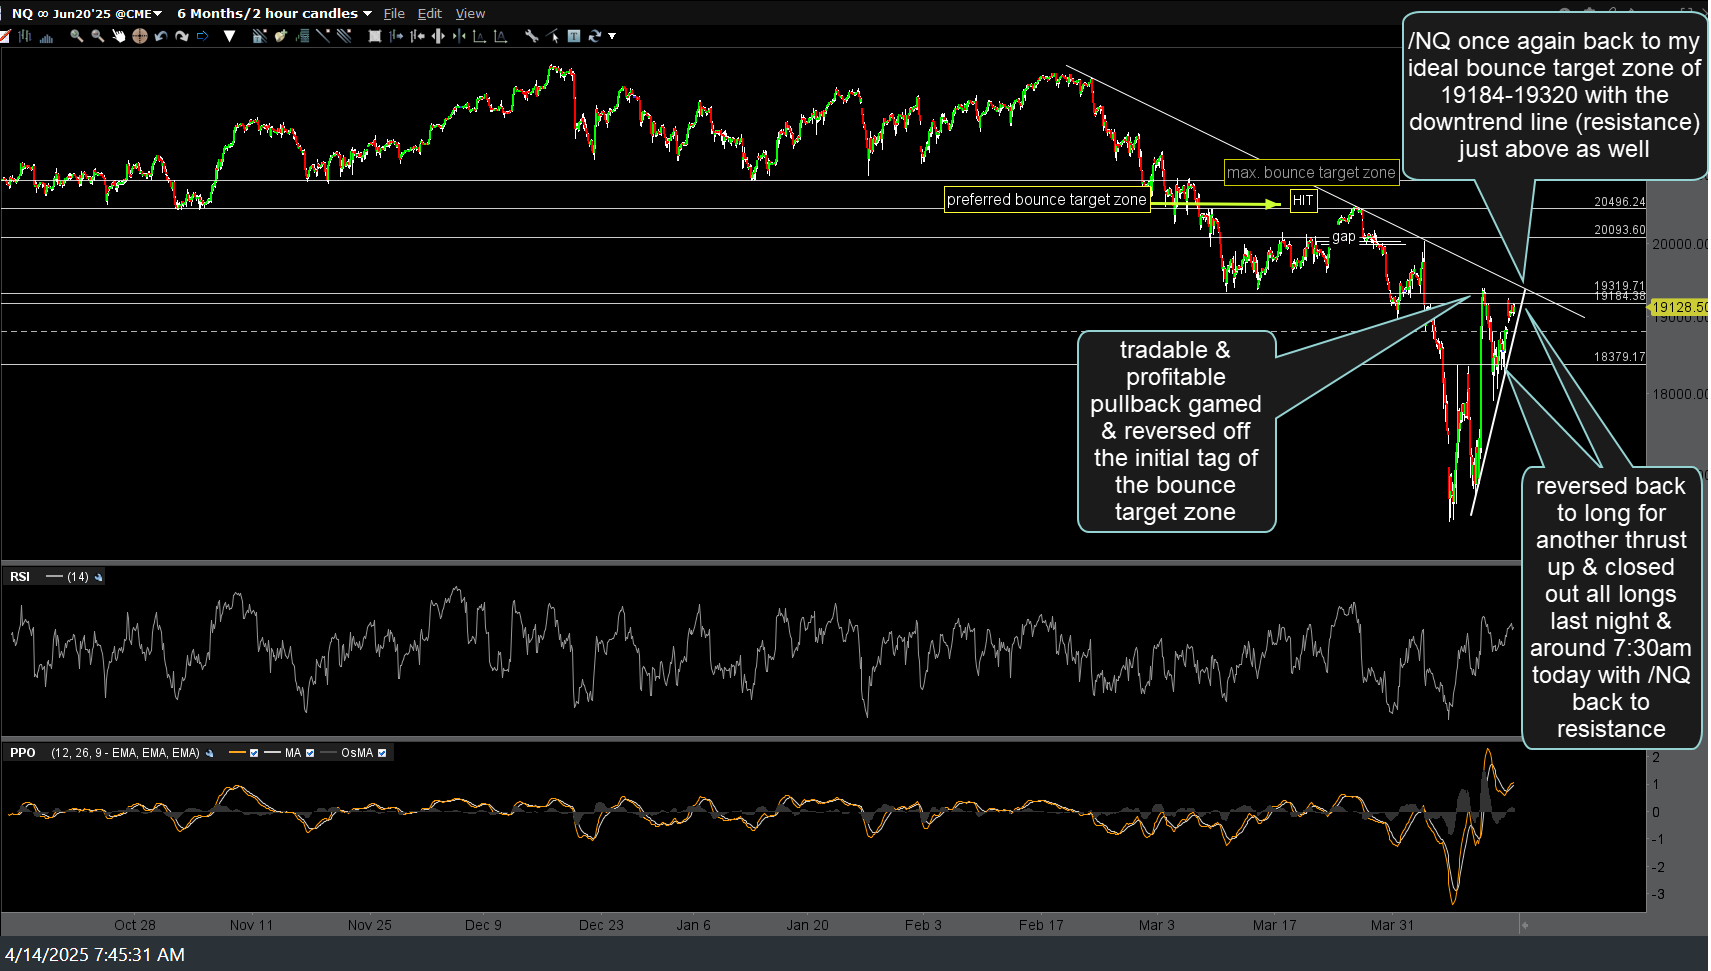
NQ 120m April 14th

NQ 120m April 24th
I would also be remiss not to add that this week kicks off the peak of earnings season with the most important market-moving stocks scheduled to report over the next couple of weeks, starting with GOOGL & INTC after the market close today followed by MSFT, META, AMZN, AAPL, & more next week. As such, I think it’s a safe bet to say that volatility will likely continue to remain elevated over the next week or so with the odds for whipsaws (false breakouts) elevated.