
As I mentioned recently, the market has been more conducive to active trading than typical swing trading recently, at least with my trading style. Here’s a setup for active traders that might want to game the next short-term pullback in the $NDX. 5-minute chart of QQQ followed by the 15-minute chart of /NQ with my current entry & exit point (price target). Stops will be determined if/when (i.e.- at what price level) an entry is triggered using a 2:1 or better R/R.
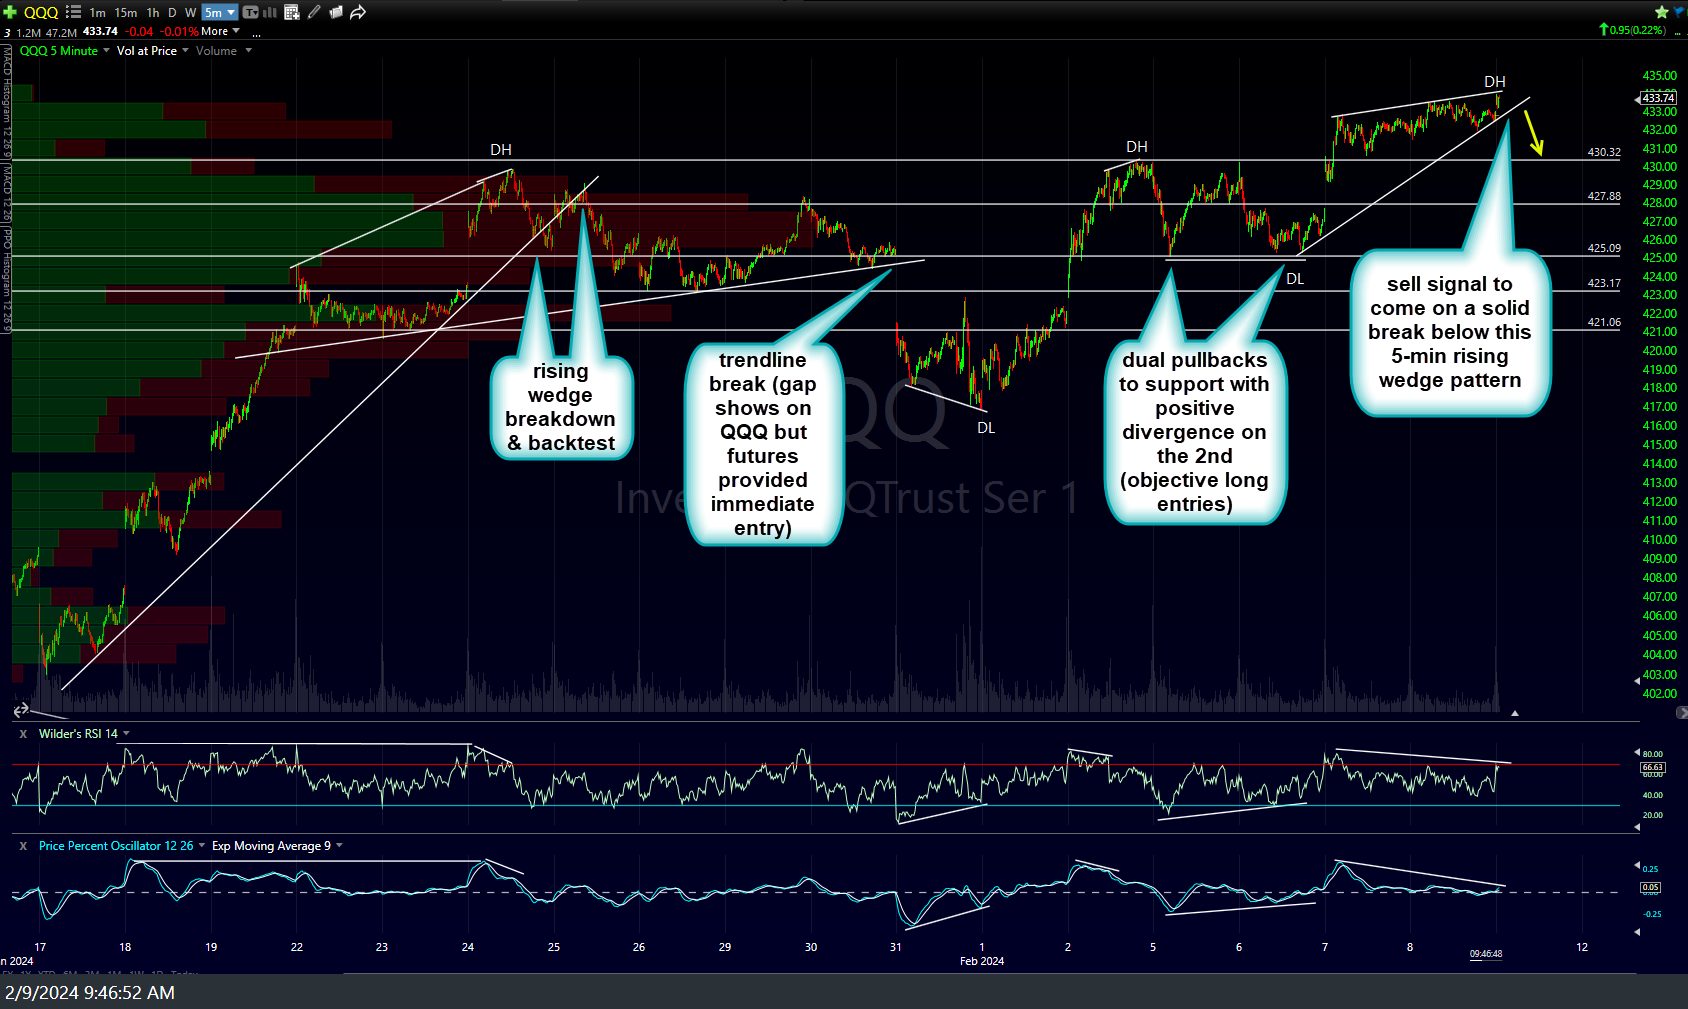
QQQ 5m Feb 9th

NQ 15m Feb 9th
I don’t plan to jump the gun on this one since IEF (10-Treasury bond) is currently testing that key 92.50ish support (top of yellow zone) with ‘potential’ bullish divergences forming, to boot. Should Treasuries hold & rally off this support level (even on a slight undercut first), that would likely provide a tailwind for the stock market, especially if EUR/USD rallies as well.
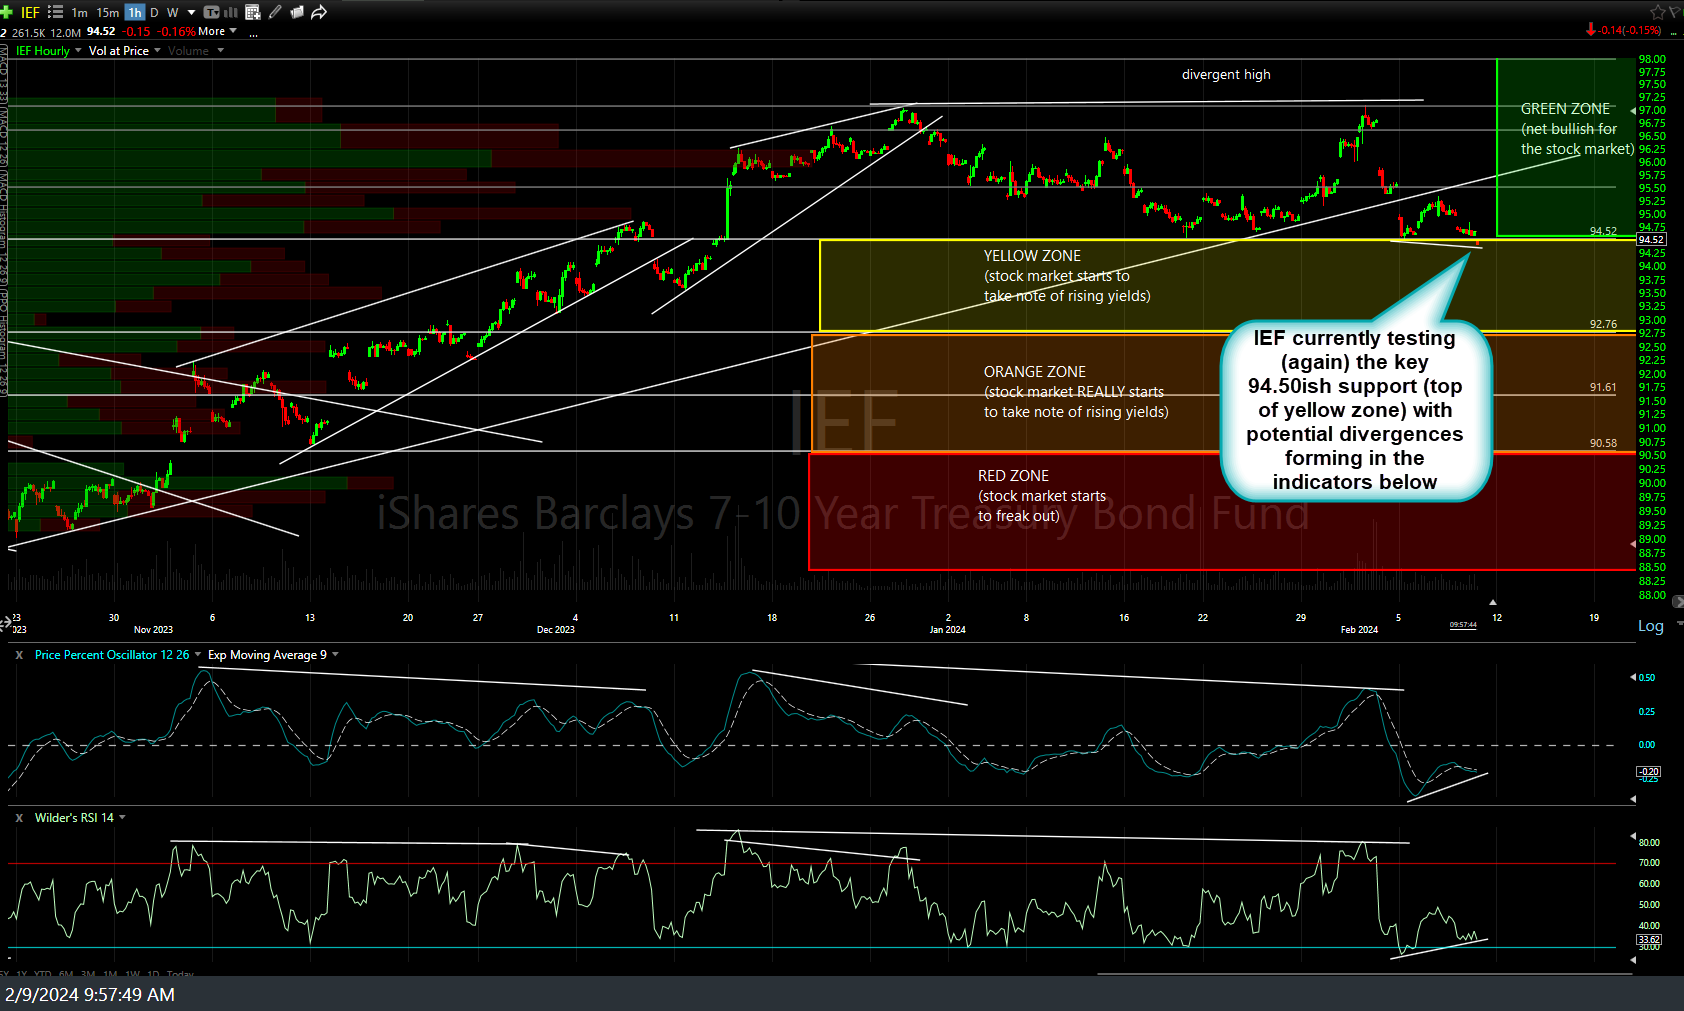
IEF 60m Feb 9th
As always, those looking for an objective long entry on the $NDX could use pullbacks to this trendline although the current divergences do increase the odds that the trendline could break soon. Hence, stops somewhat below it for those buying pullbacks to the trendline or currently long would seem prudent.