
With the negative divergences continuing to build & in light of last week’s bearish engulfing candles, the next sell signal on /NQ (Nasdaq 100 futures, or QQQ) will come on a solid break below this 15-minute uptrend line & the intersecting 20000ish price support. 15-minute & 60-minute charts below.
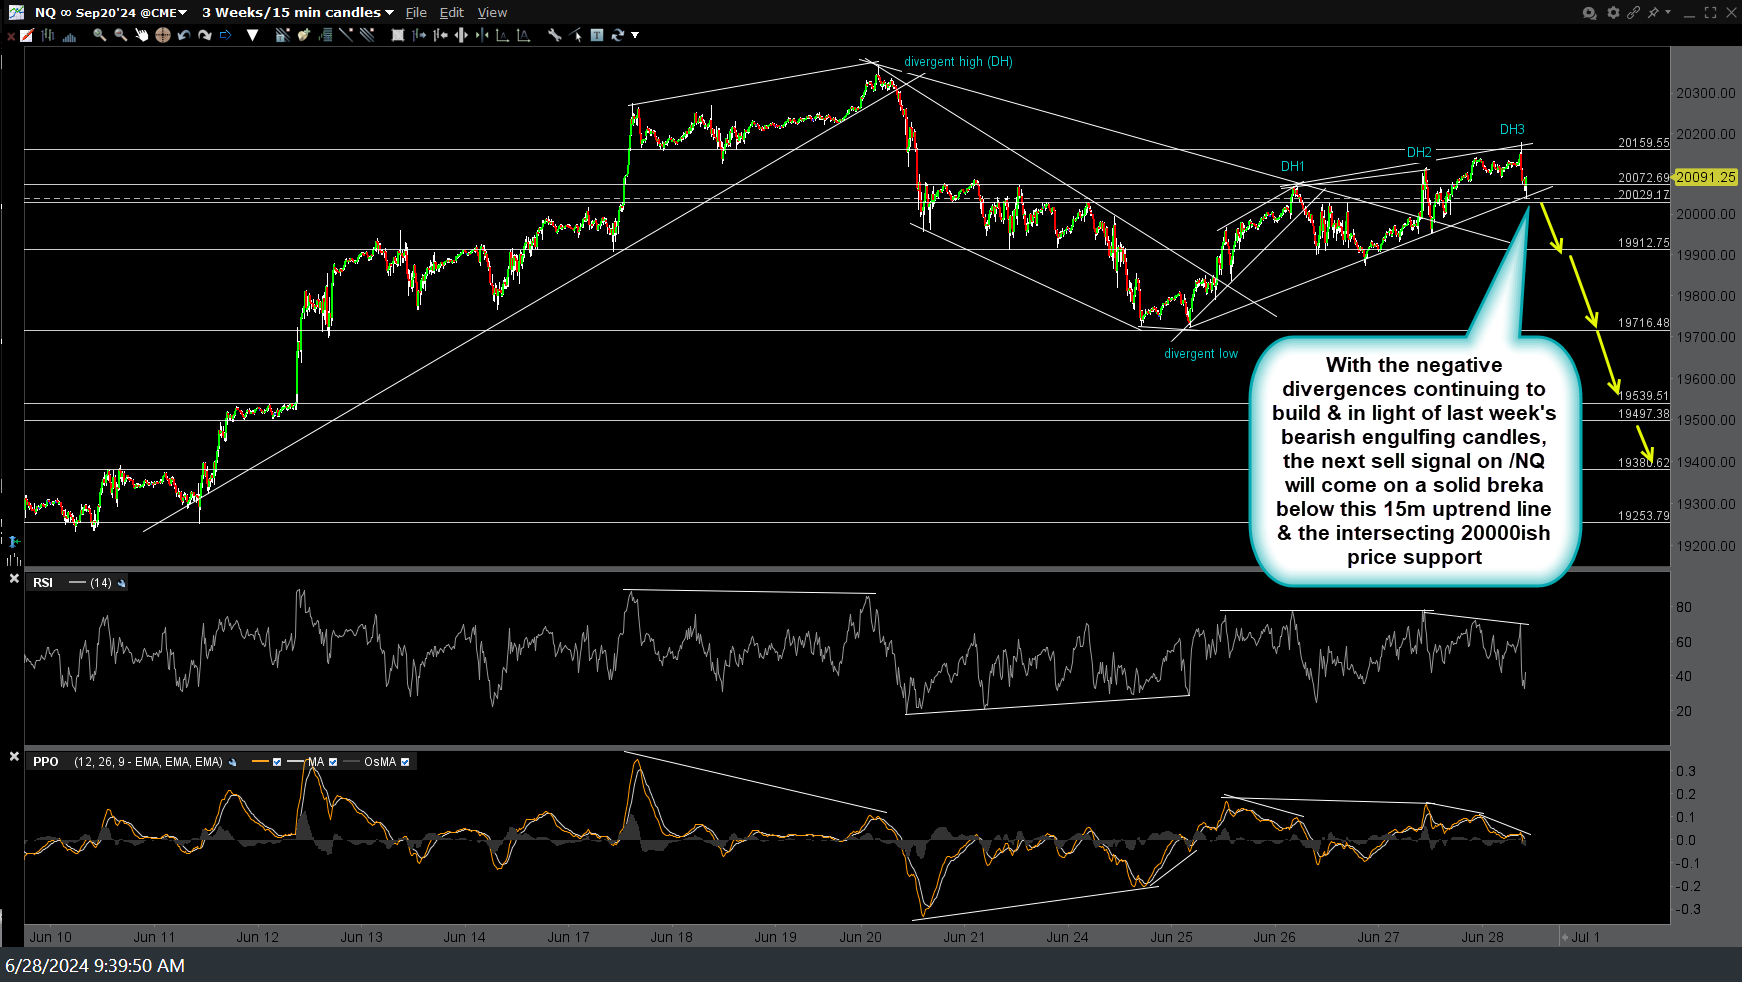
NQ 15m June 28th
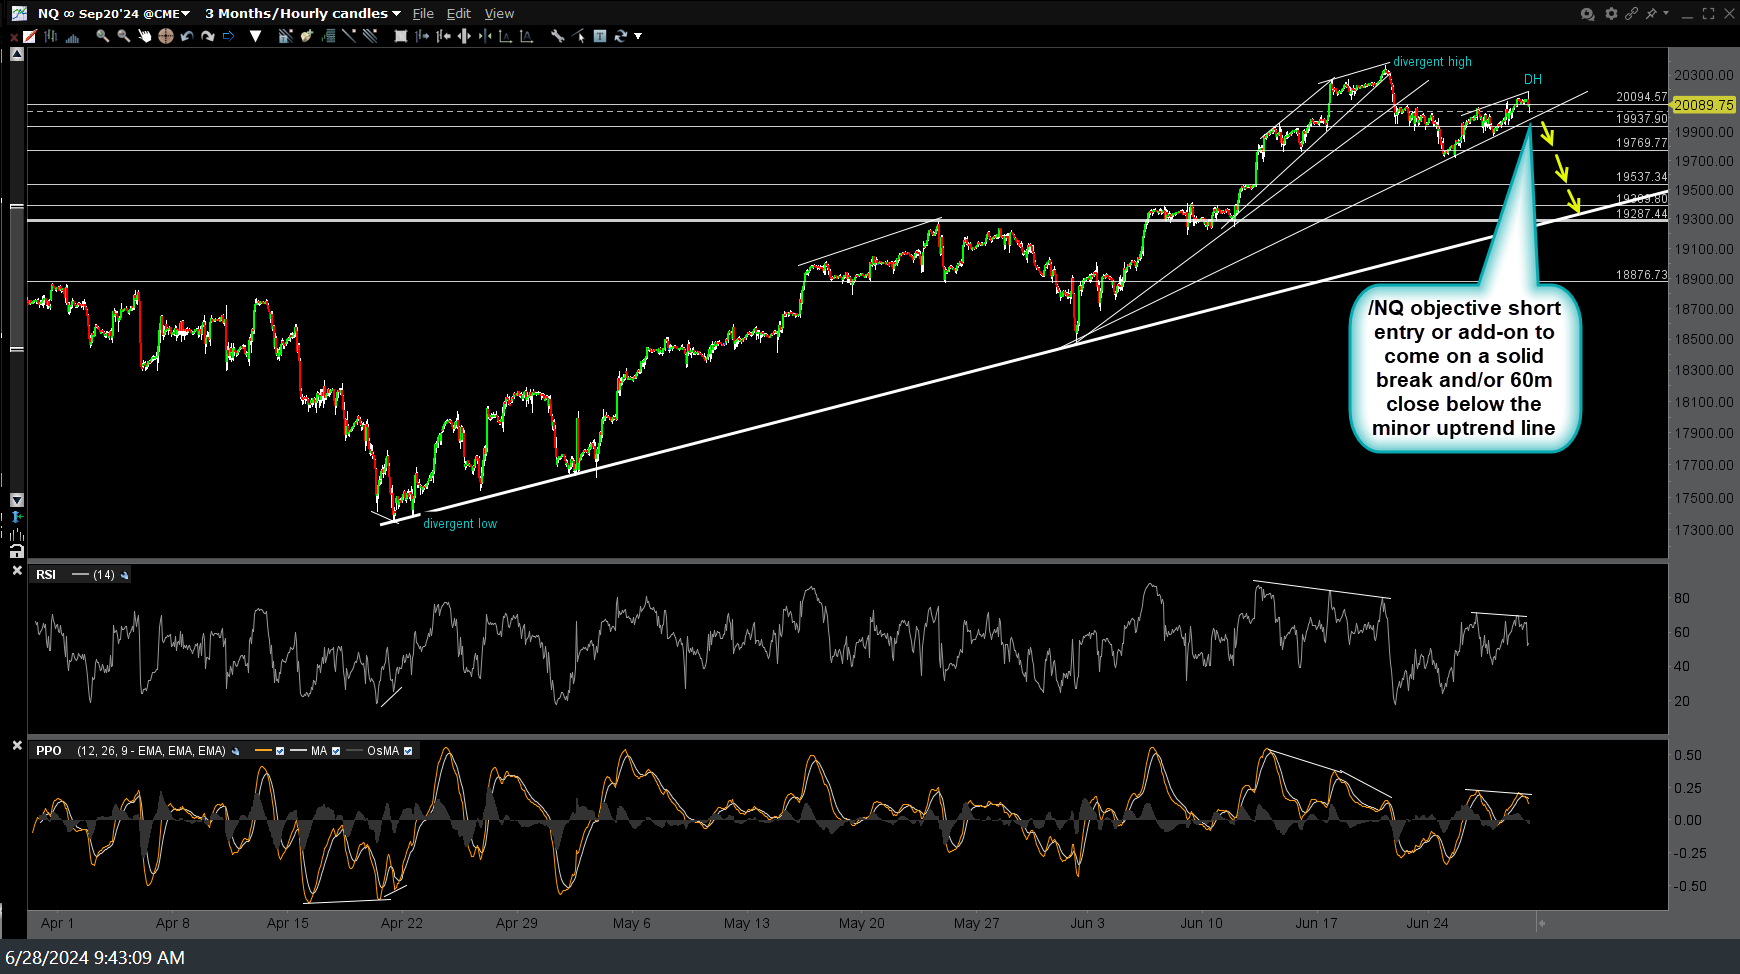
NQ 60m June 28th
Keep in mind that the uptrend line off the April lows which is the current near-term swing target on /NQ & QQQ also forms this larger rising wedge pattern on the weekly chart, a break of which will most likely be the catalyst for a relatively swift move down to my first long-term swing/trend target. Weekly chart of QQQ below.

QQQ weekly June 28th