
/NQ (Nasdaq 100 futures or /MNQ micro contract) offers what may be the last objective short entry in a while here on the backtest of the recently broken uptrend line with the negative divergences still intact on the 60-minute chart below.
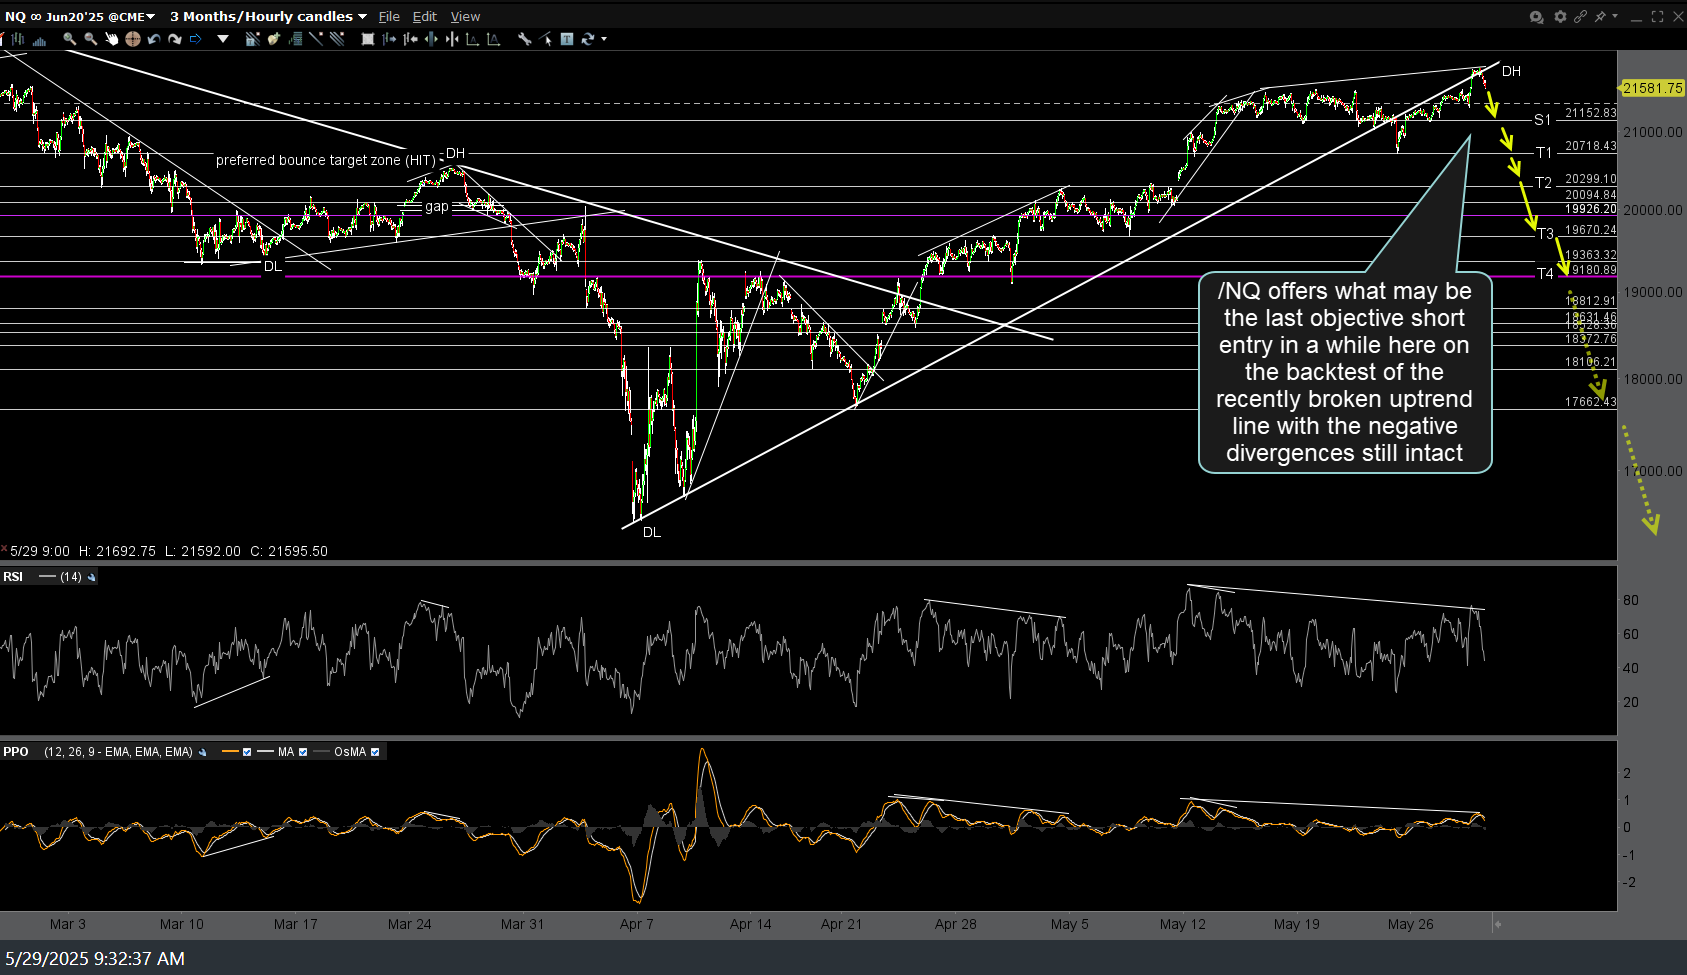
NQ 60m May 29th
Likewise, QQQ still offers an objective short entry following the recent sell signals on the QQQ & SPY daily charts (trendline breaks) with the divergences still intact on this 60-minute chart on today’s marginal new high.
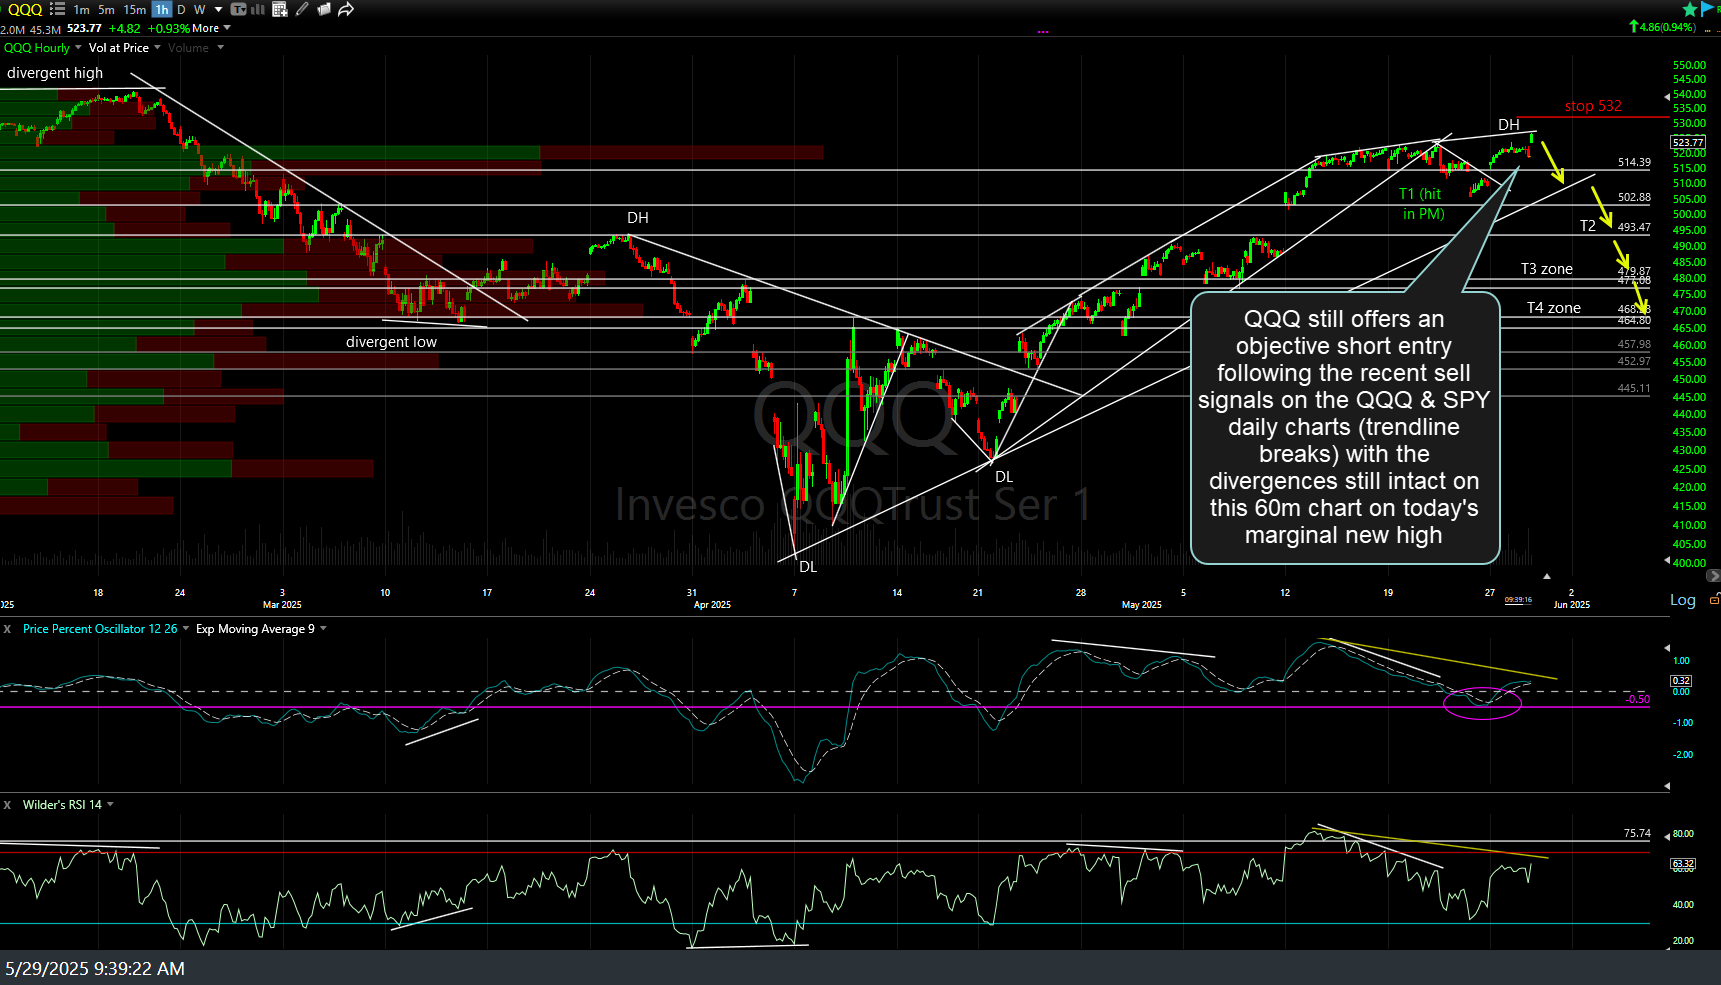
QQQ 60m May 29th
/RTY (Russelll 2000 Small-cap Index futures, or /M2K micro futures contract) continues to offer an objective short entry on this divergent high at the primary downtrend line (resistance) with stops somewhat above (relative to one’s price target). 60-minute chart below.
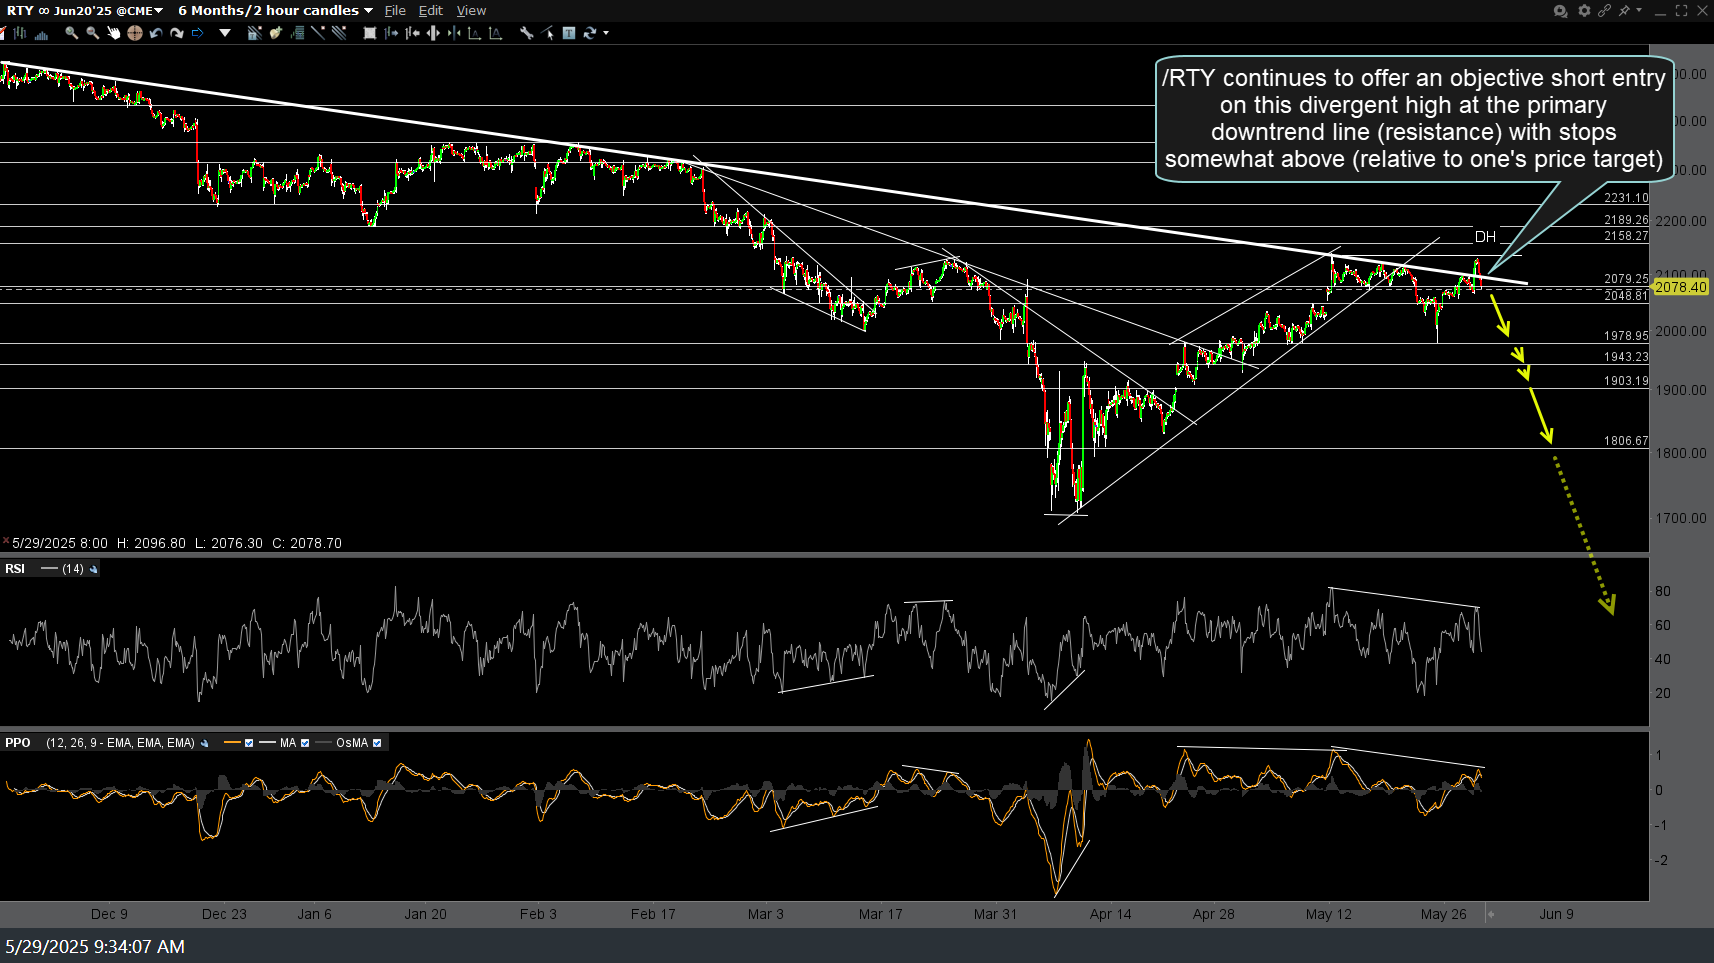
RTY 60m May 29th
For ETF traders, IWM continues to offer an objective short entry or add-on at or just below the primary downtrend line (resistance).
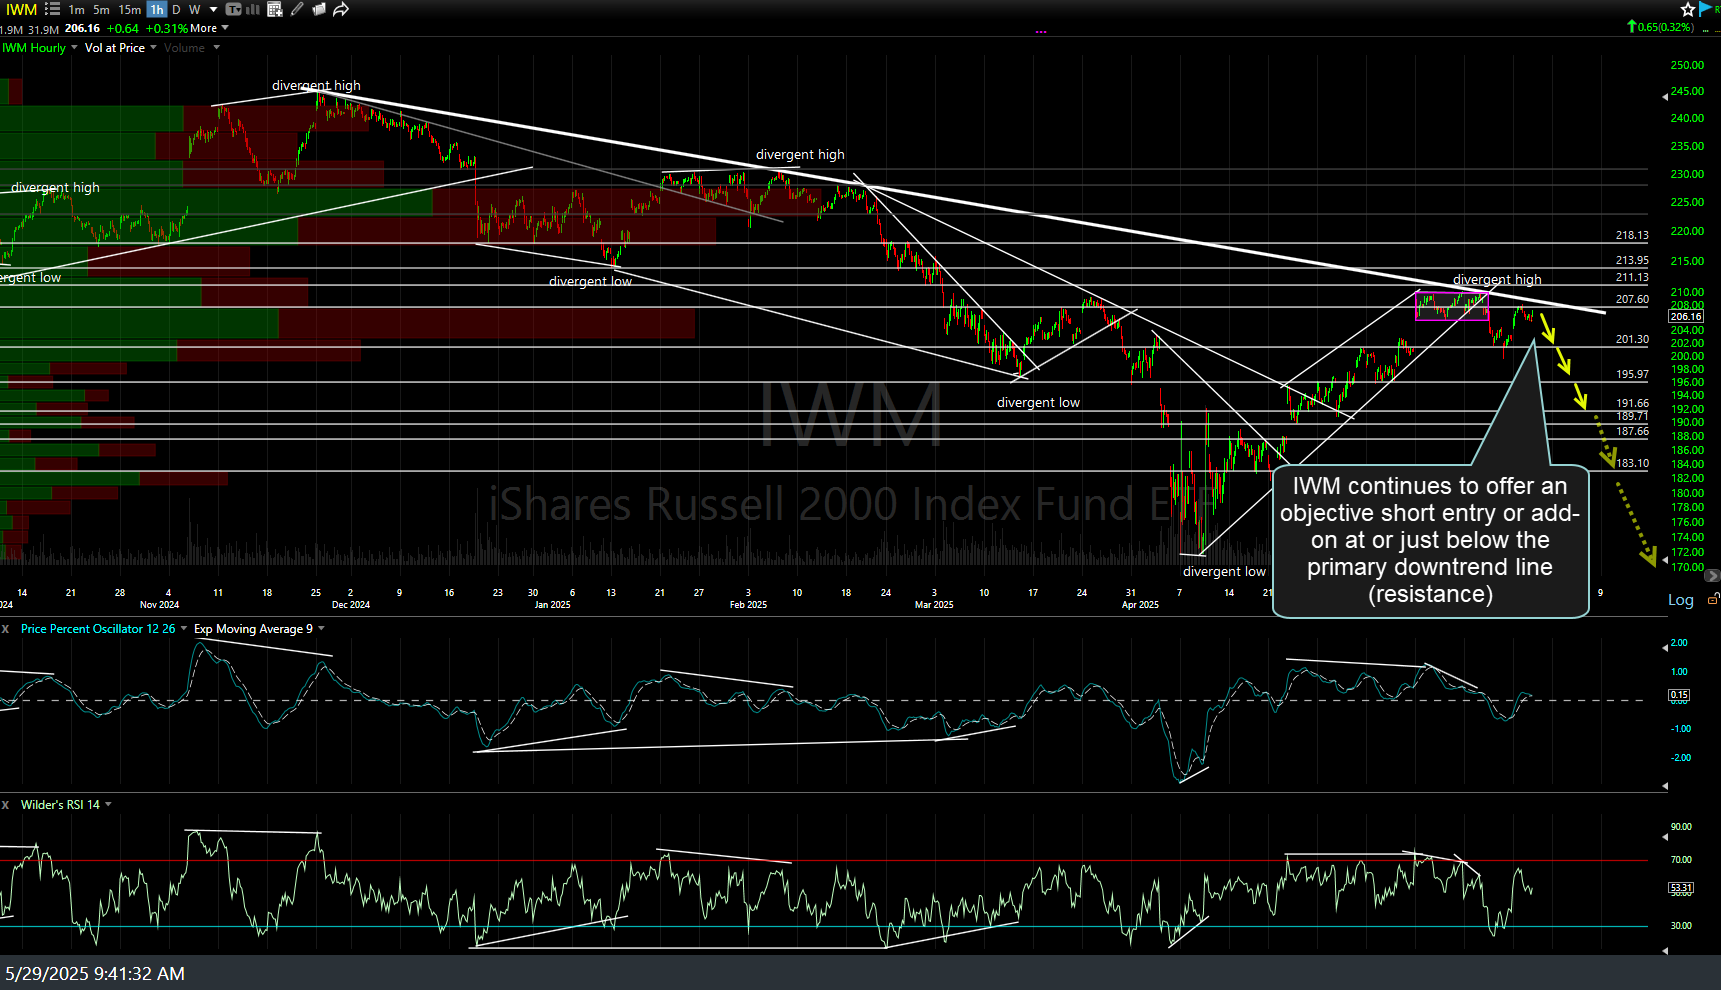
IWM 60m May 29th
Despite the recent resiliency of the near-term uptrend, several (but not all) of my intermeditate to longer-term trend indicators remain on sell signals. Additionally, while the major indices remain within spitting distance of new highs, the technical posture of the charts above still offer objective entries or add-ons to both typical swing trades (typical holding period measures in days or weeks) with stops not far above, providing for an attractive R/R, especially to the deeper near-term swing targets (T3 & T4 on QQQ) as well as a potential longer-term swing/trend trade, although stops on the latter should allow for the potential for a marginal new all-time high on QQQ (but not IWM).
Additionally, longer-term swing & trend traders might opt for both SPY & QQQ to fall back below their respective 200-day moving averages before taking a starter or full position (if scaling into a starter/fractional position around current levels).