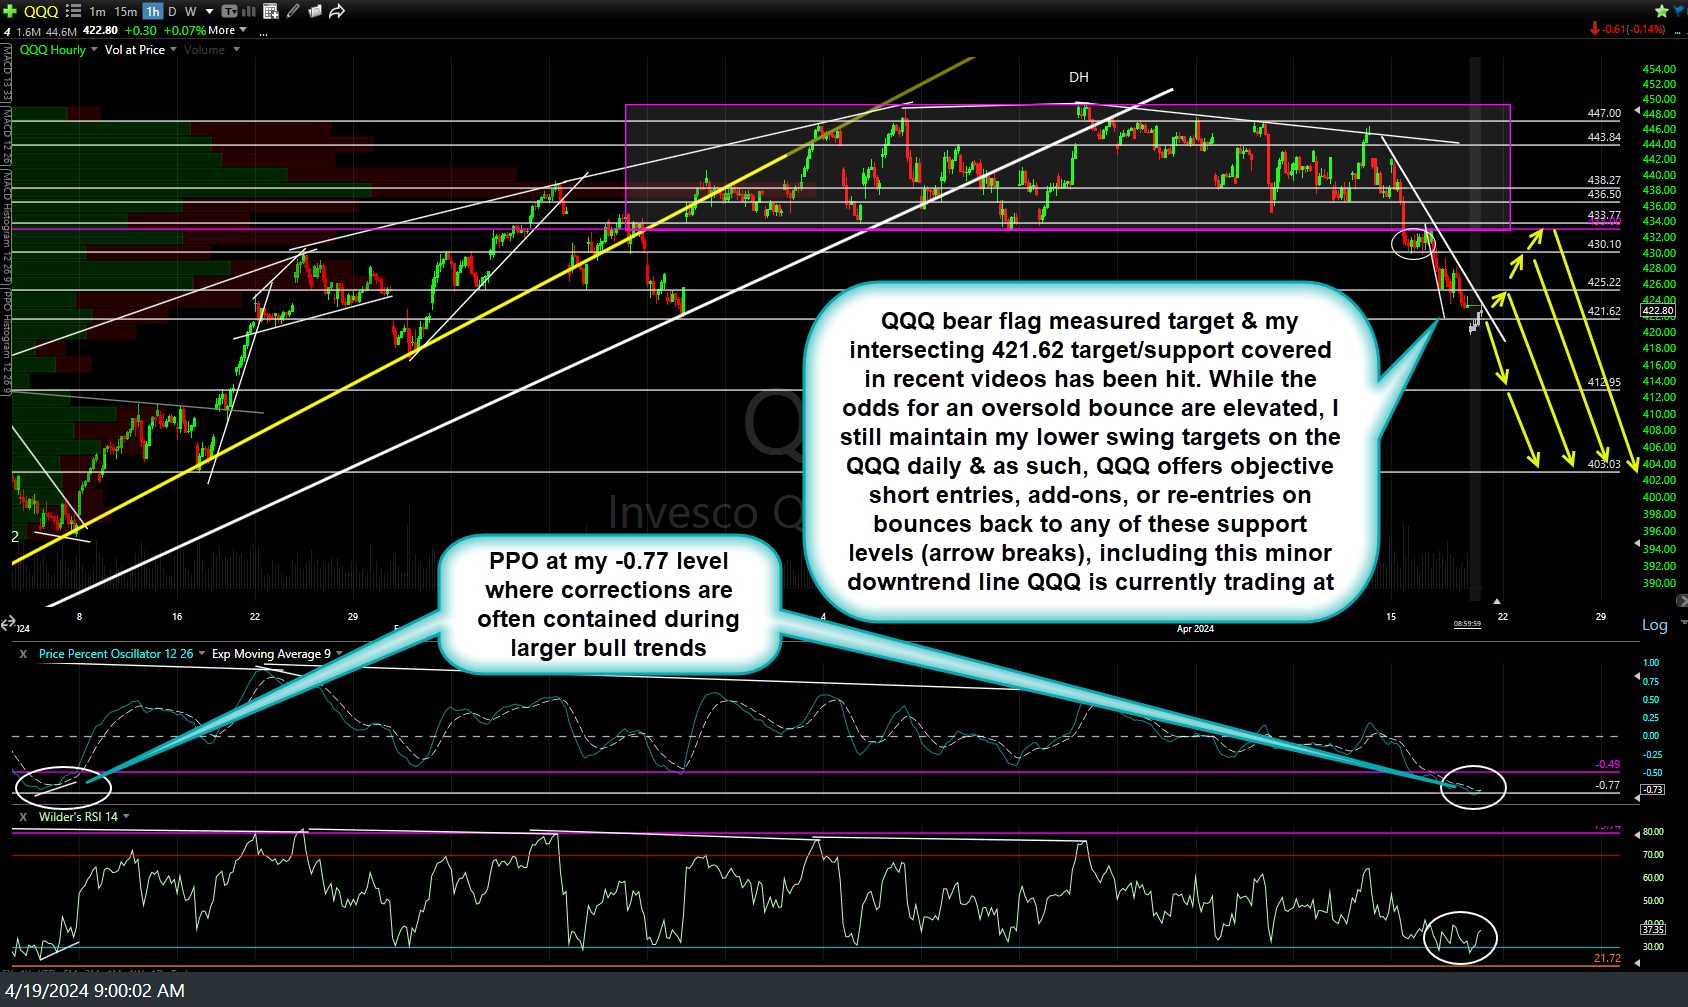
The QQQ 60-minute bear flag measured target & my intersecting 421.62 target/support covered in recent videos has been hit. While the odds for an oversold bounce are elevated, I still maintain my lower swing targets on the QQQ daily & as such, QQQ offers objective short entries, add-ons, or re-entries on bounces back to any of these support levels (arrow breaks), including this minor downtrend line QQQ is currently trading at.
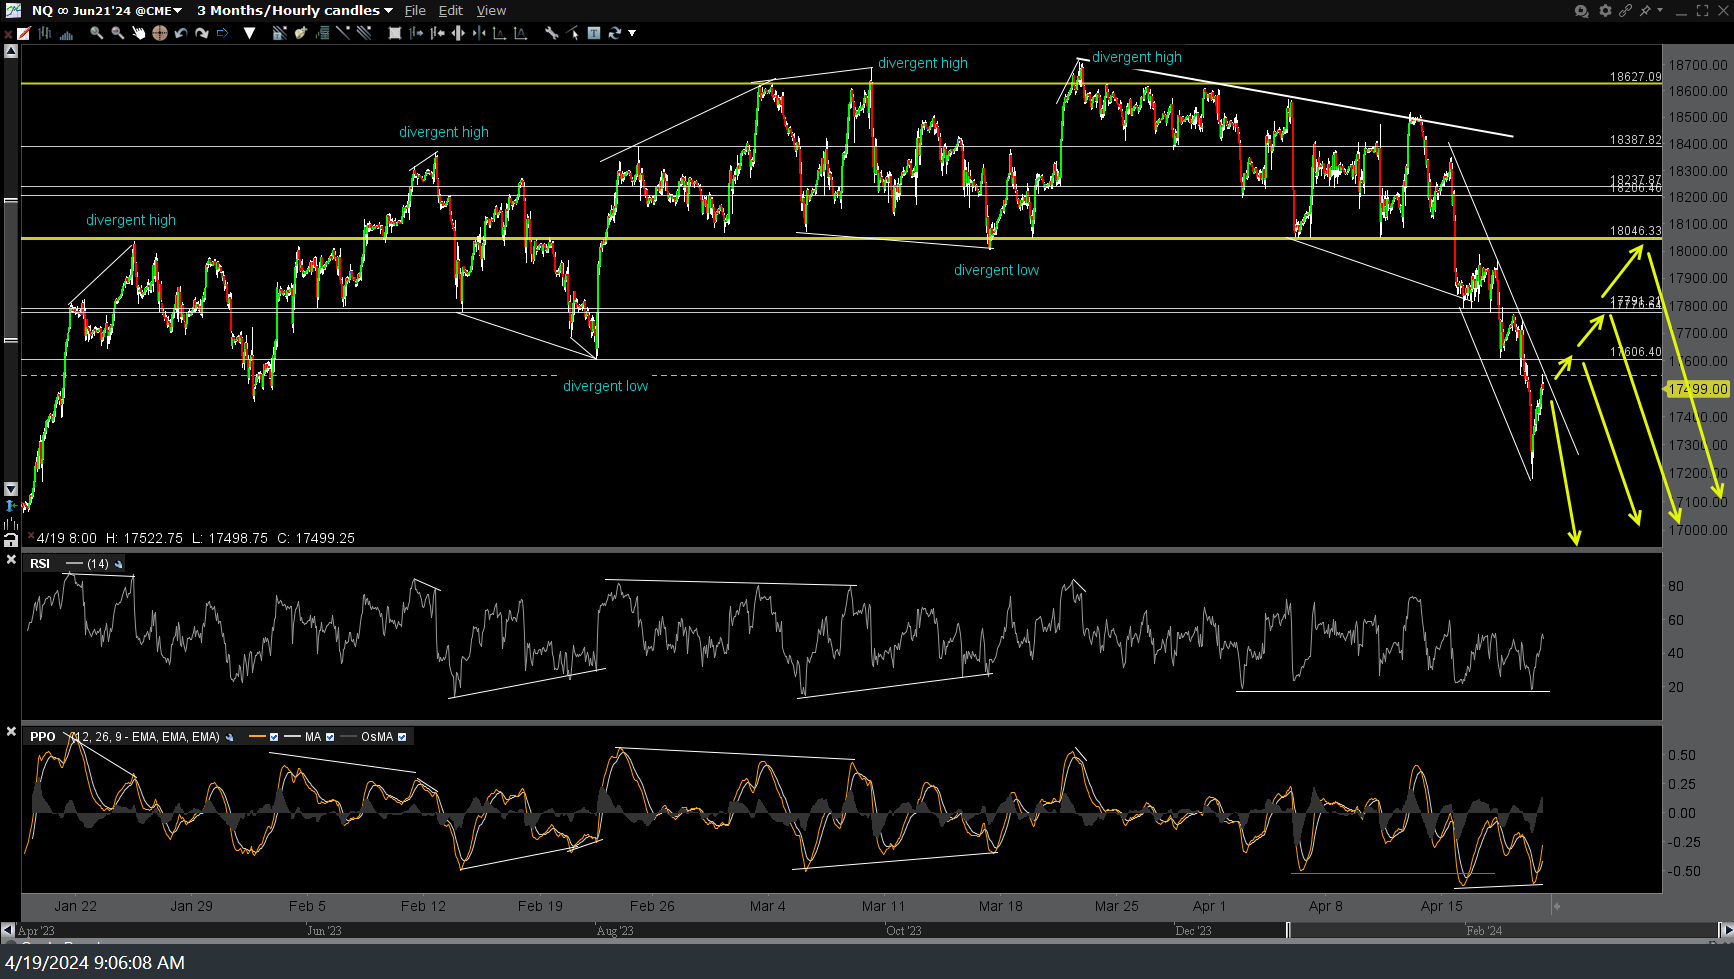
The /NQ (Nasdaq 100 futures) 60-minute chart below also has some overhead resistance levels, including the same max. bounce target (equivalent to QQQ 433) of 18046 (bottom of the recently broken trading range.
A couple of points worth noting: If the charts with multiple arrows above seem confusing or wishy-washy on where I think the Q’s are going from here, they shouldn’t be. I have not wavered on my convictions that the Nasdaq 100 would break down below the trading range and where is will most likely go before any meaningful (5-10%+ & multi-day/week) rally. i.e the T4/T5/200-day moving average zone on my daily chart.
Basically, these arrows all lead lower with some relative minor variance allotted for the potential for a counter-trend bounce although the first end-point for the overnight & pre-market session for the recovery rally that took place after the futures plunged last night is right where we are now. These “objective” shorting levels would mean different things to different traders. Those already at their “all-in” or full short positioning might opt to sit tight & ride out any counter-trend bounces up to but not too far back into the trading range while active traders that might have booked profits here at the bear flag measured target might look to add back shorts (or sell a long bounce position) at any or all of the resistance levels on the charts above. Sell the rips, cover (or sit tight, if typical swing trading) the dips (until/if/when we approach my final swing targets).


