
Starting out with the big picture (i.e.- long-term outlook) via the QQQ weekly chart, the Q’s remain below the top of my ‘Market Top Range’ first posted back on June 26th (first chart below) with any equal or marginal new high (to the top of the range) soon to extend the negative divergences that were in place at the July 10th peak. Anything move much above that 512ish level at the top of the range has the potential to take out the divergences & open the door to a continued move higher although the technical case for my preferred scenario & long-term targets from late June is still very much intact for now.
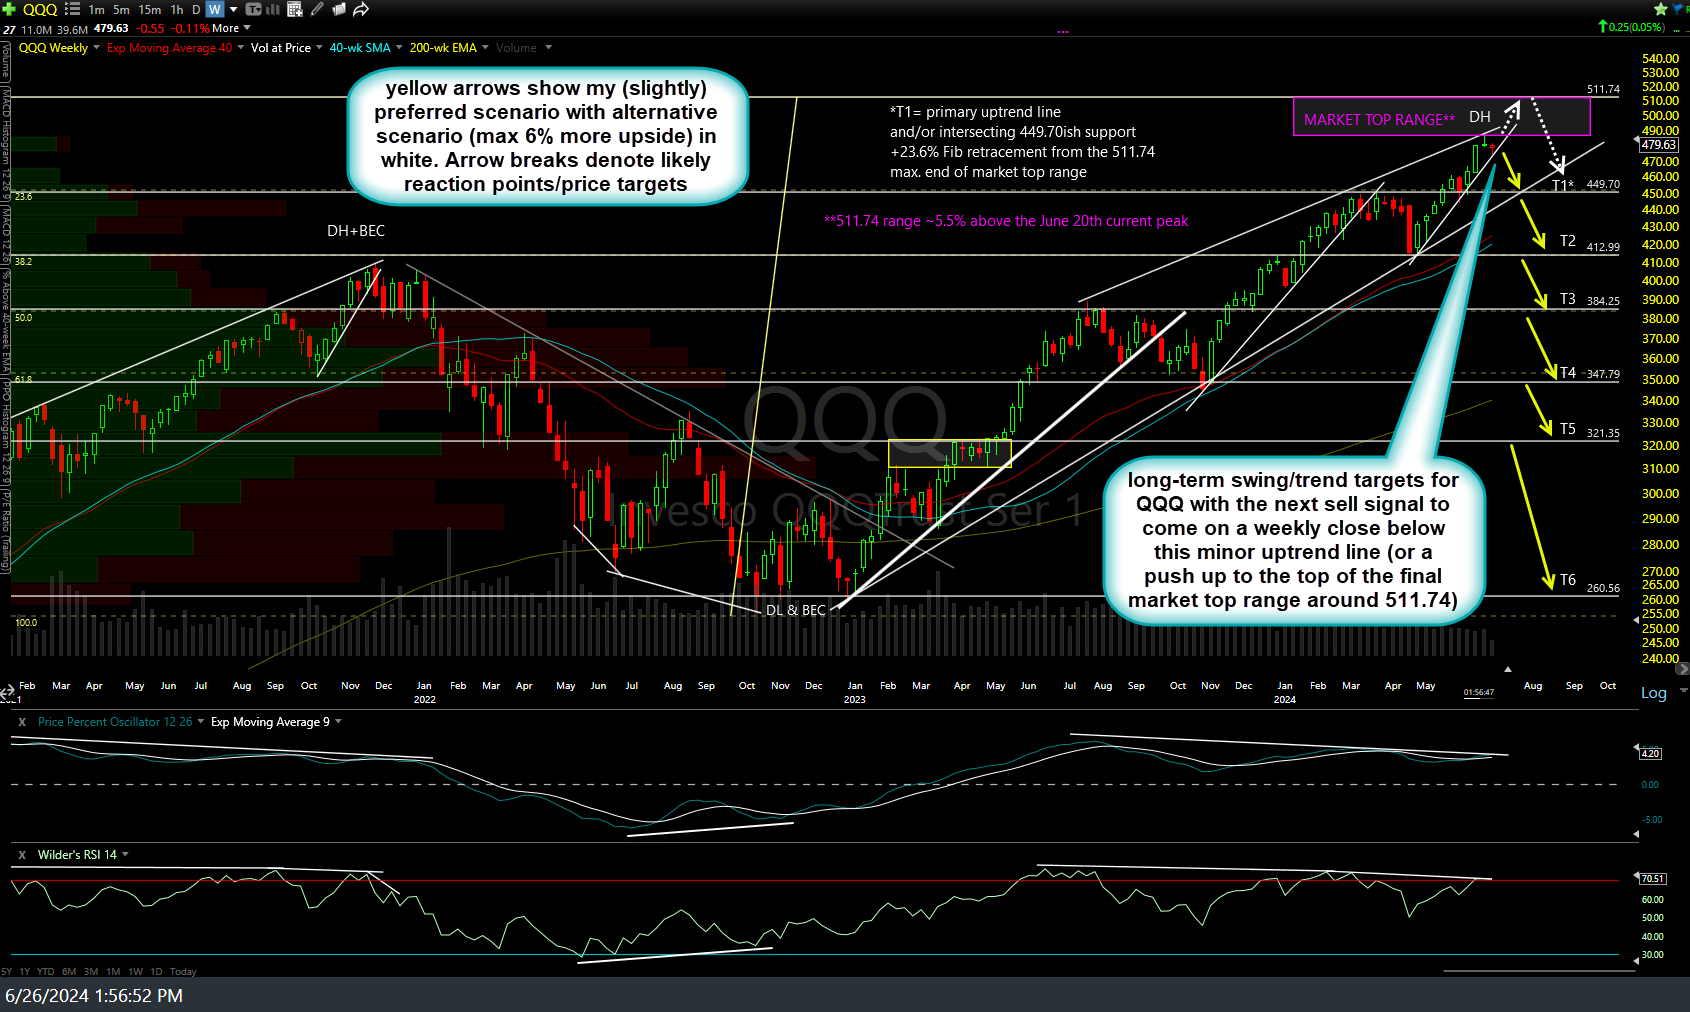
QQQ weekly June 26th

QQQ weekly Oct 14th
Zooming down to the 60-minute charts to get some clarity on the near-term picture, QQQ is currently testing of the top of that key July 17th gap (i.e.- resistance) that I was highlighting before Hurricane Milton took me offline last week. While this rally into resistance, especially with negative divergences in place from the 60-minute chart all the way out to the daily, weekly, & even monthly charts offers an objective short entry with a stop somewhat above, the next sell signal will come on a solid break and/or 60-minute close below this minor uptrend line and/or the more significant uptrend line off the early August lows just below it.
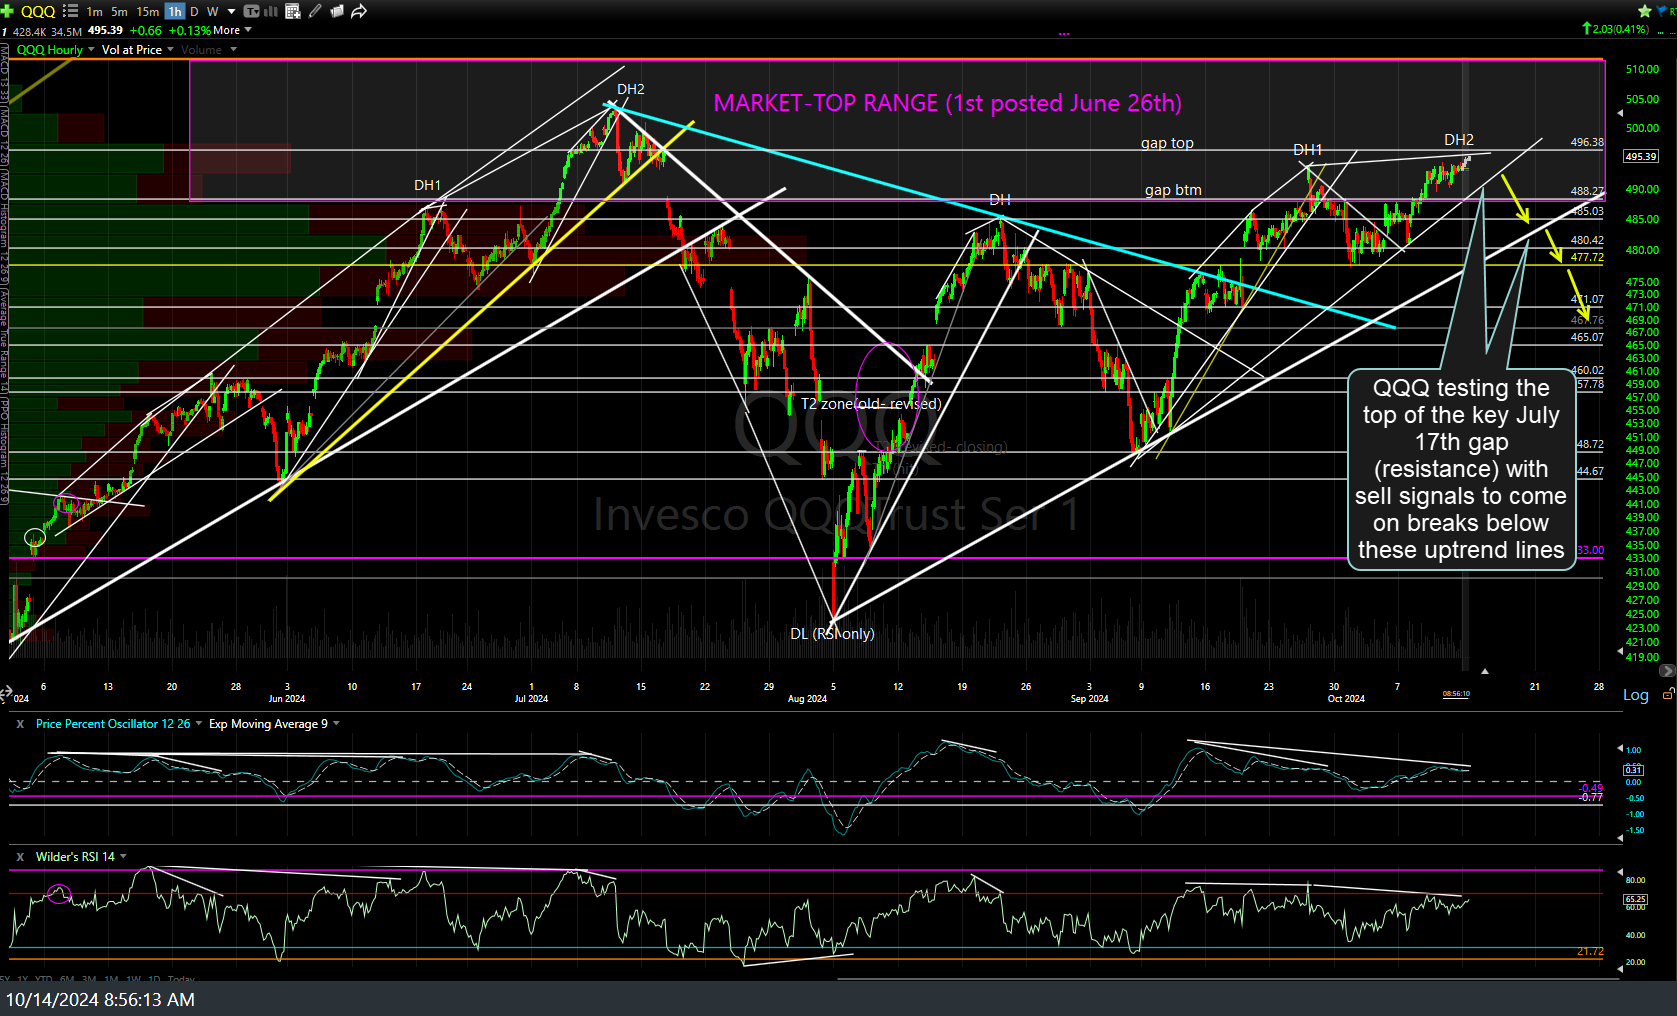
QQQ 60m Oct 14th
Likewise, /NQ (Nasdaq 100 futures) sell signal to come on a break below this 60-minute uptrend line, ideally with the current negative divergences still intact.
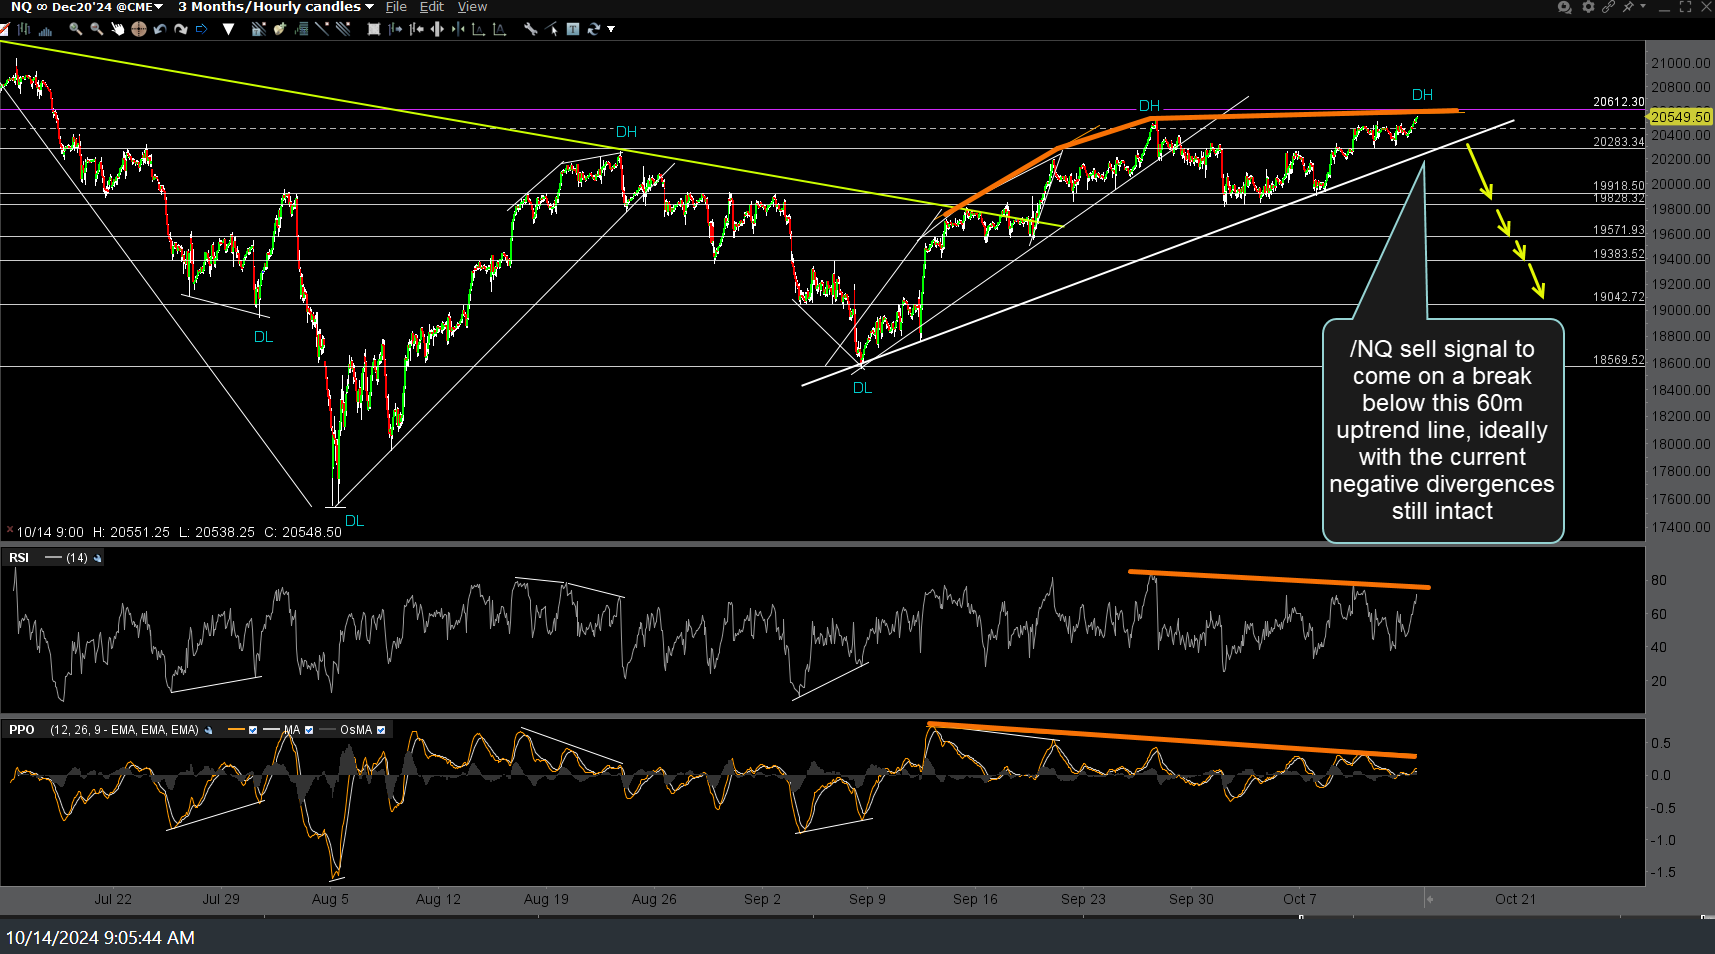
NQ 60m Oct 14th
On an closely related note, NVDA (NVIDIA Corp) took out the downtrend line & top of most recent shorting zone last week although the next sell signal will come on a break below this 60-minute rising wedge pattern with a more powerful sell signal if/when last week’s breakout above the downtrend line fails.
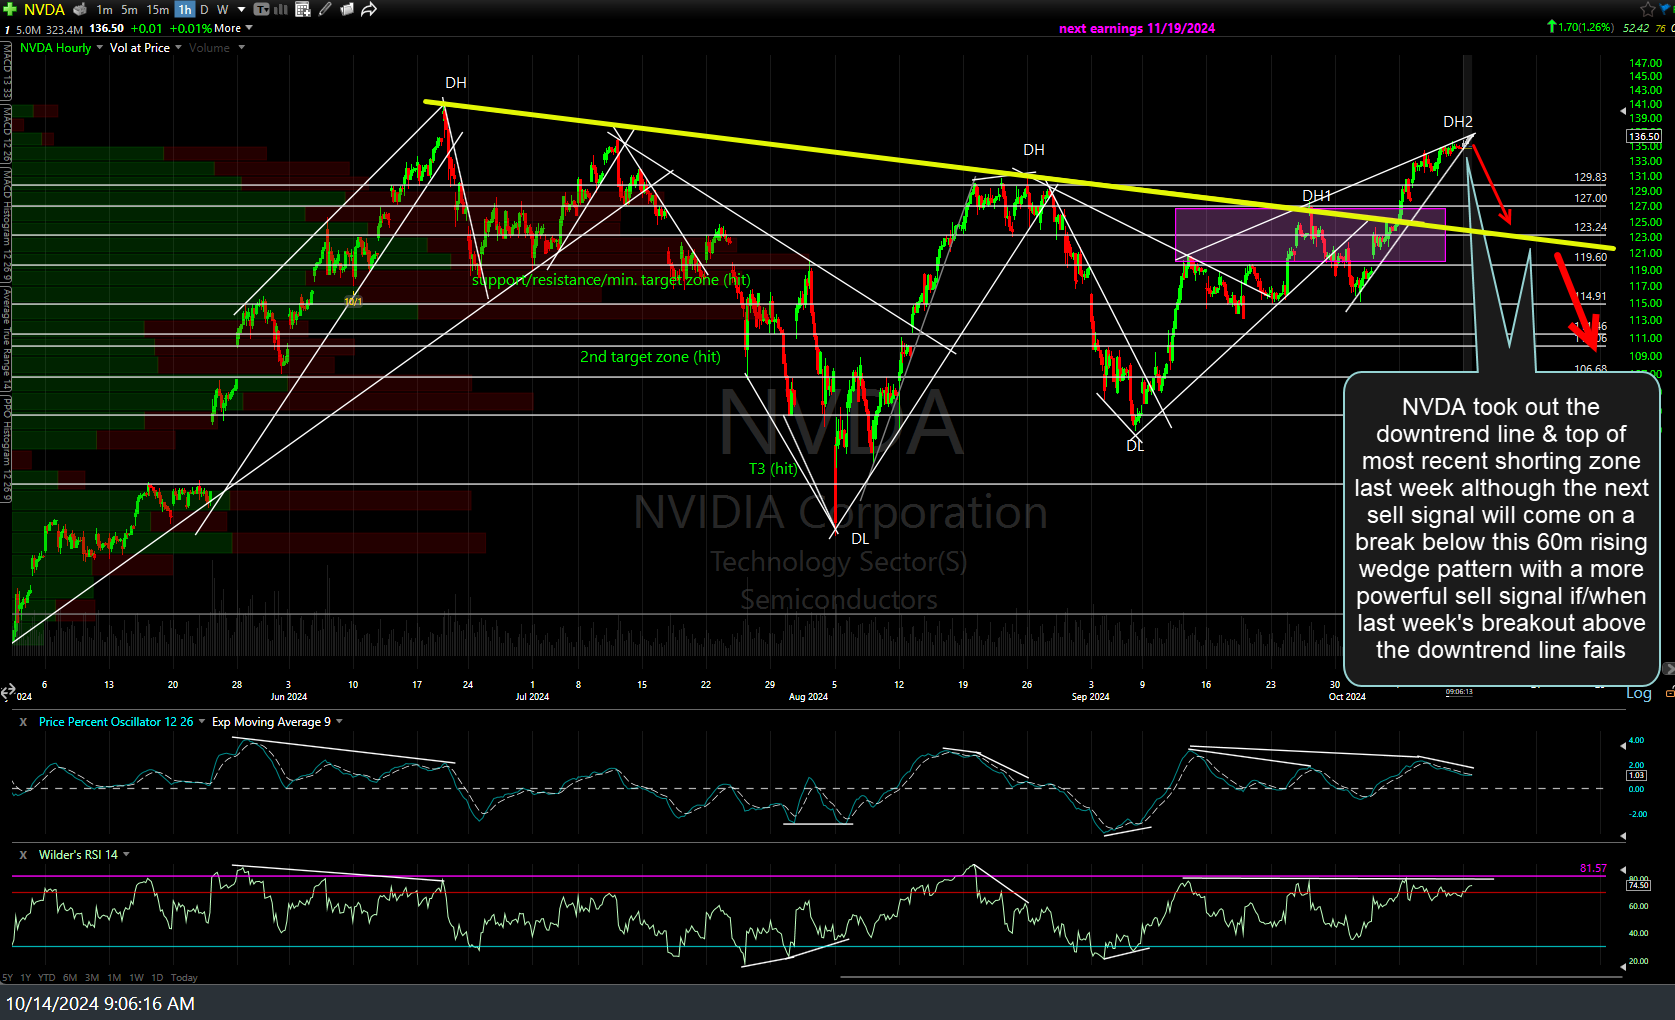
NVDA 60m Oct 14th
Updates on Treasuries, gold, silver, GDX & more to follow soon.