
The 60-minute chart of /NQ (Nasdaq 100 futures) lists a couple of near-term pullback targets & two additional ‘potential targets’ for active traders with sell signals on /NQ (or QQQ) to come on breaks below these minor & primary uptrend lines.
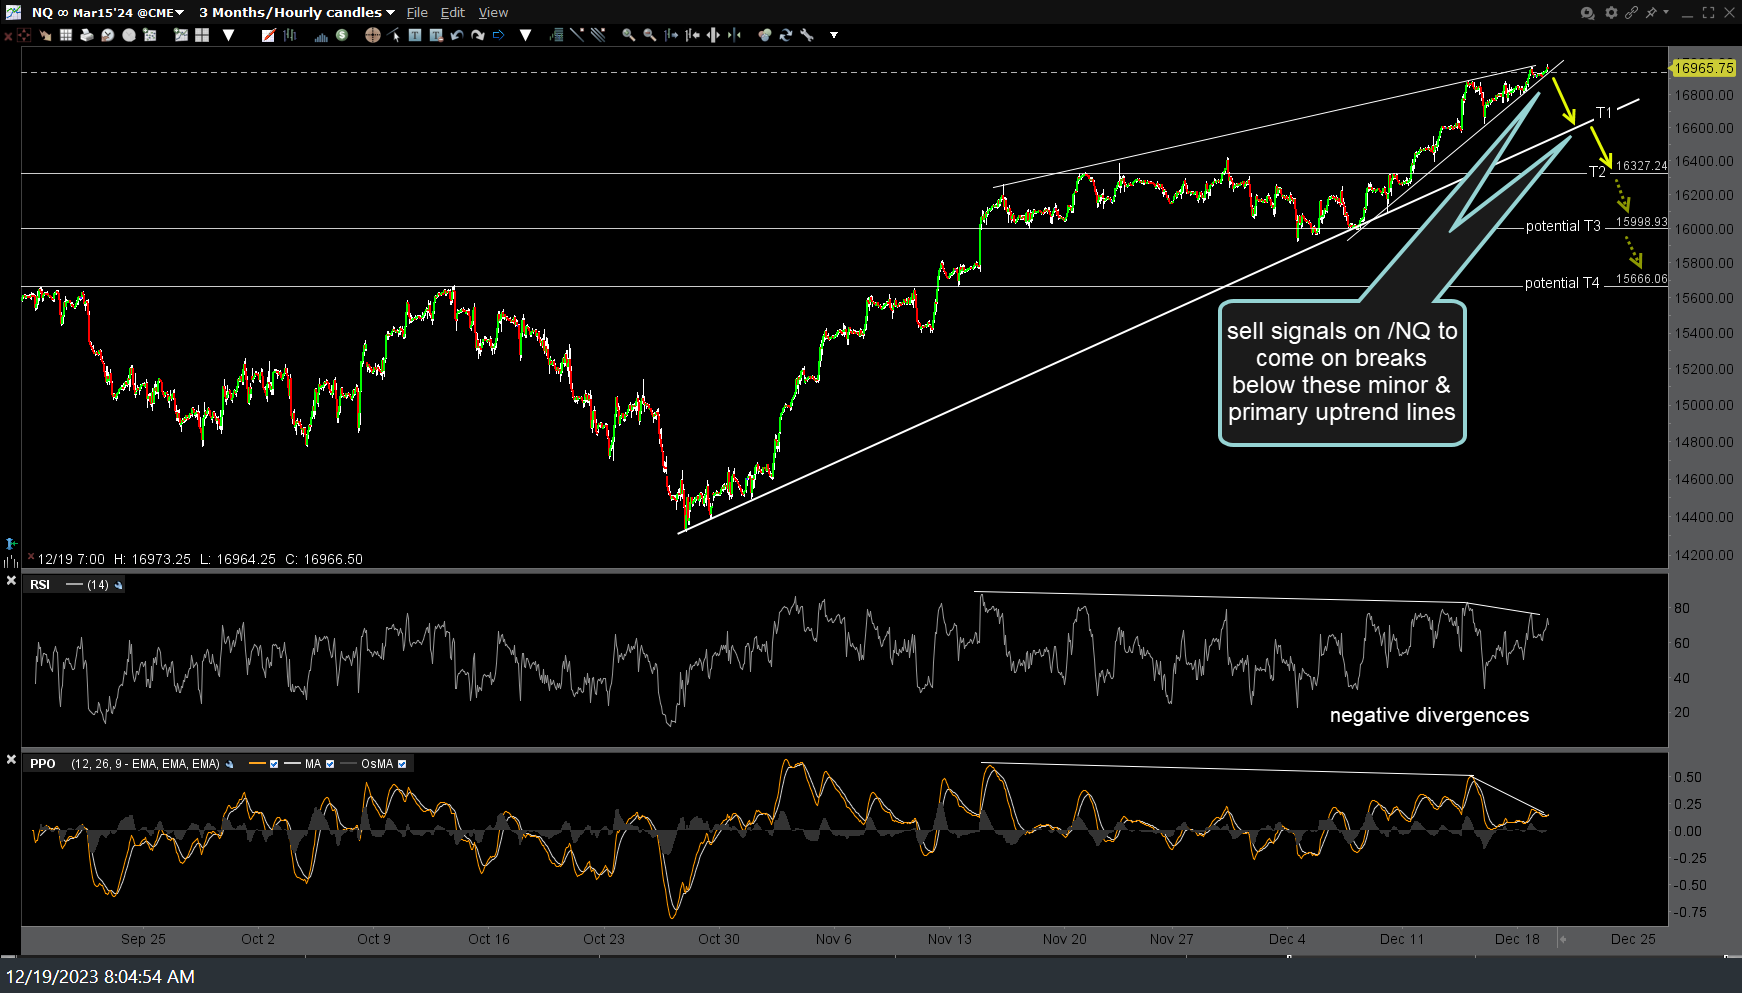
NQ 60m Dec 19th
Comparable trendlines & initial price targets on the 60-minute chart of QQQ below.
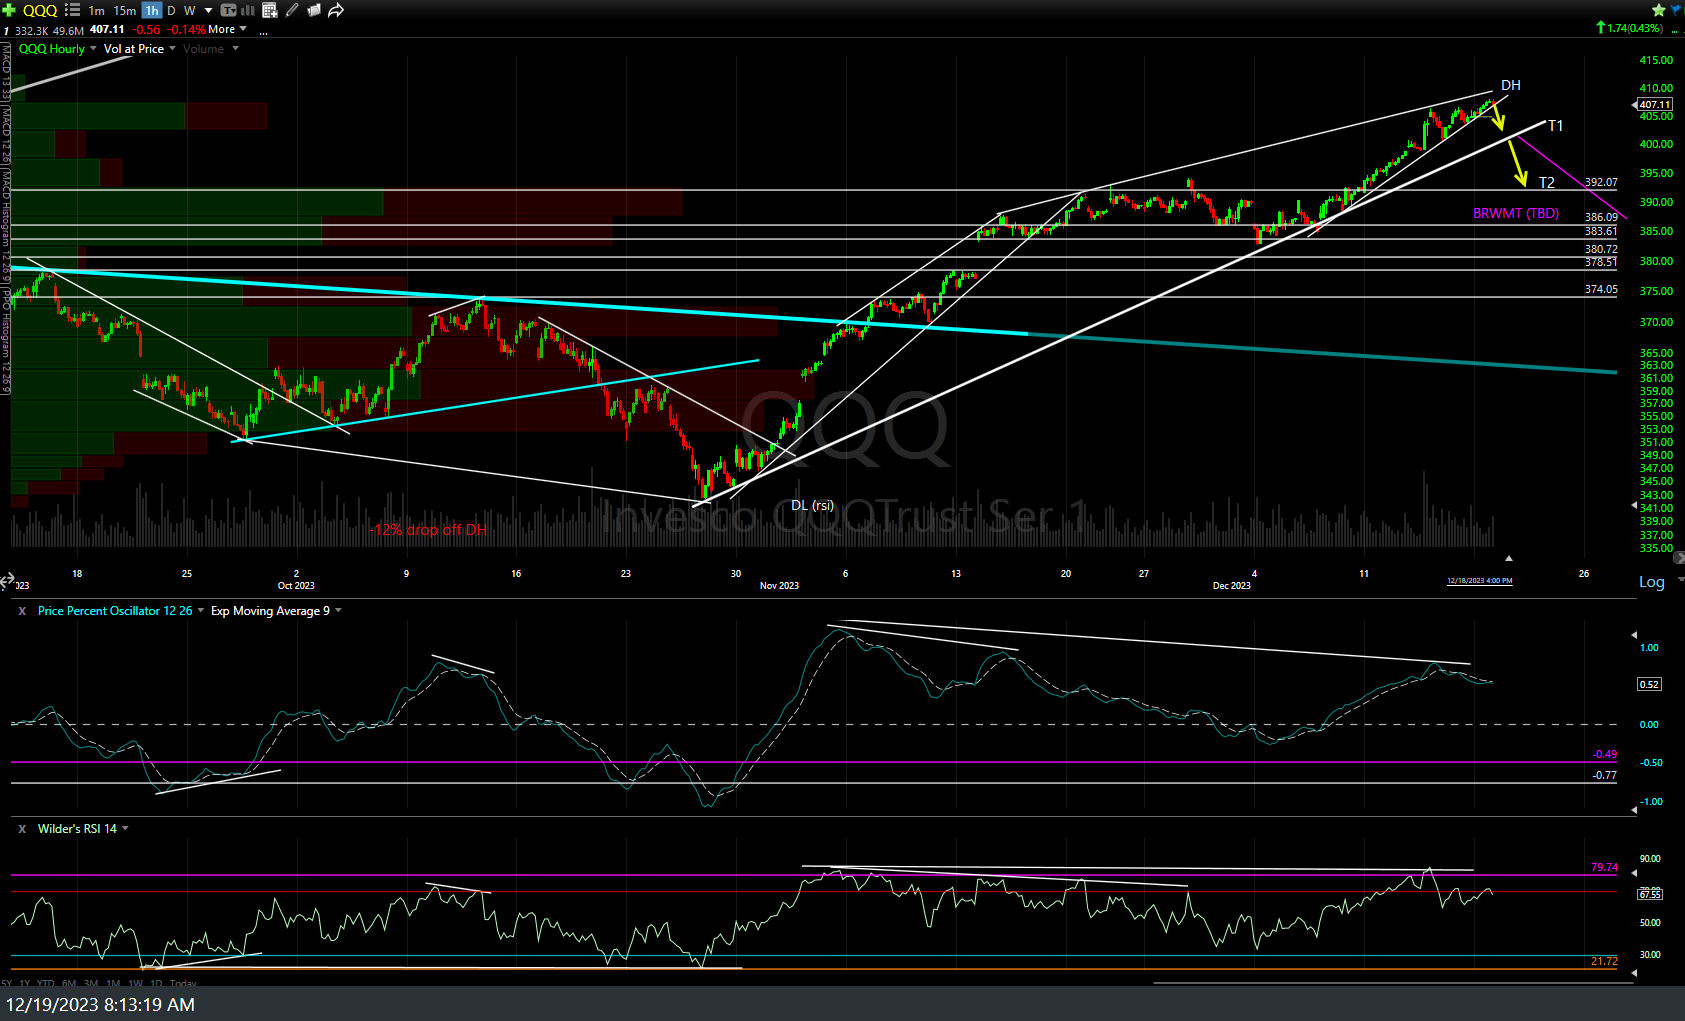
QQQ 60m Dec 19th
These targets & this short-term active trading setup is separate from the recent longer-term swing trade on /NQ or QQQ, with the suggested stop on that trade still to be based on a close above today’s highs (or yesterday’s, should QQQ open & remain negative all day today).