I continually make a point to differentiate between the trading opportunities for both active traders as well as typical swing/trend traders. While I believe that all traders, regardless of trading style & typical holding period (minutes, hours, days, weeks, or months) should incorporate the use of multiple time frames into their analysis, active traders, with holding periods typically measured in hours or days, will generally use intraday charts ranging from 1-minute to 60-minute time frames. Typical swing traders, with holding periods usually measured in weeks or months, will generally focus on the 60-minute, daily, & weekly time frames.
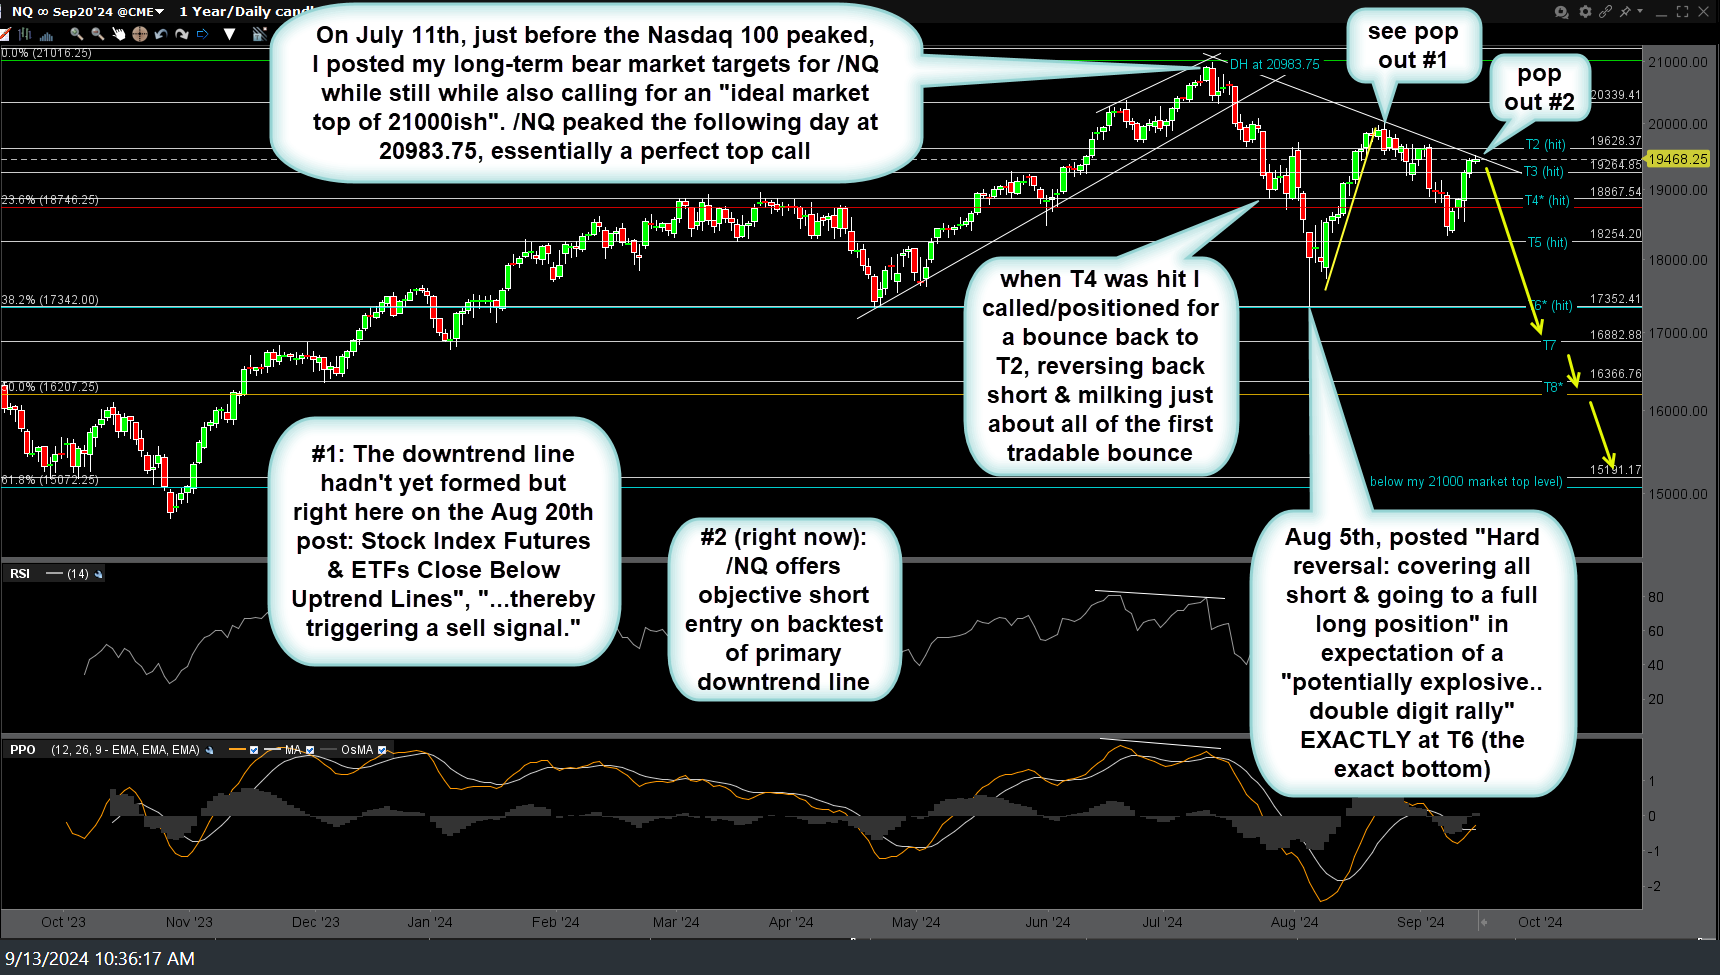
Which brings me to this post which is geared for typical swing & trend traders. On July 10th, the day before the Nasdaq 100 futures peaked, I posted my long-term bear market targets for /NQ while still while also calling for an “ideal market top of 21000ish”, which would mean a little more upside before the top was in. /NQ peaked the following day at 20983.75, less than 1/10th of 1% from 2100 so essentially a perfect top call.
Market-top & bottom calls are a dime a dozen & if you make enough of them, you will be bound to be correct sooner or later. While I’ve laid out the fundamental & technical case for an outsized & impending bear market for some time now, to the best of my recollection, this was my first ever prediction of not just “we may have just put in a top” but more precisely, ‘the top isn’t in yet.. we’re probably going higher still… and here is how far we are likely to go before the top will be in..’ call first laid out in this June 26th post listing topping ranges & long-term price targets for QQQ, SPY, & NVDA (which I had already made the case for a top being put in on June 20th), then followed up with this June 10th post to including both my market top range as well as the more precise “ideal” level within that very tight and already precise range, for the top on the Nasdaq 100 futures (/NQ) along with my long-term swing/trend price targets. (daily chart from that July 10th post below)

NQ daily July 10th
From there, the Nasdaq 100 went on to rally just one more day, peaking on July 11th at a high of 20,983.75, essentially right at that 21000ish “ideal market top level which also correlated to my comparable “ideal” market top level for QQQ first laid out in late June. Like I said, make enough top calls…. However, FF about 2-weeks & 10% lower on the Nasdaq 100 (biggest drop in months) and we have /NQ falling to my fourth daily/trend target (T4) where I posted favoring a “tradable” bounce off that level, even following up with a precise target of a bounce back to T2 (former support, now resistance). July 26th & July 28th daily charts of /NQ highlighting that objective level to book profits on the shorts, go long to game a quick 4% bounce, reverse back to short and so basically “enhance” the longer-term trend trade by an additional +8% profit side-stepping a 4% drawdown & turning that into a profit, then profiting another 4% on the drop back down from T2 to T4 where the trade was reversed).
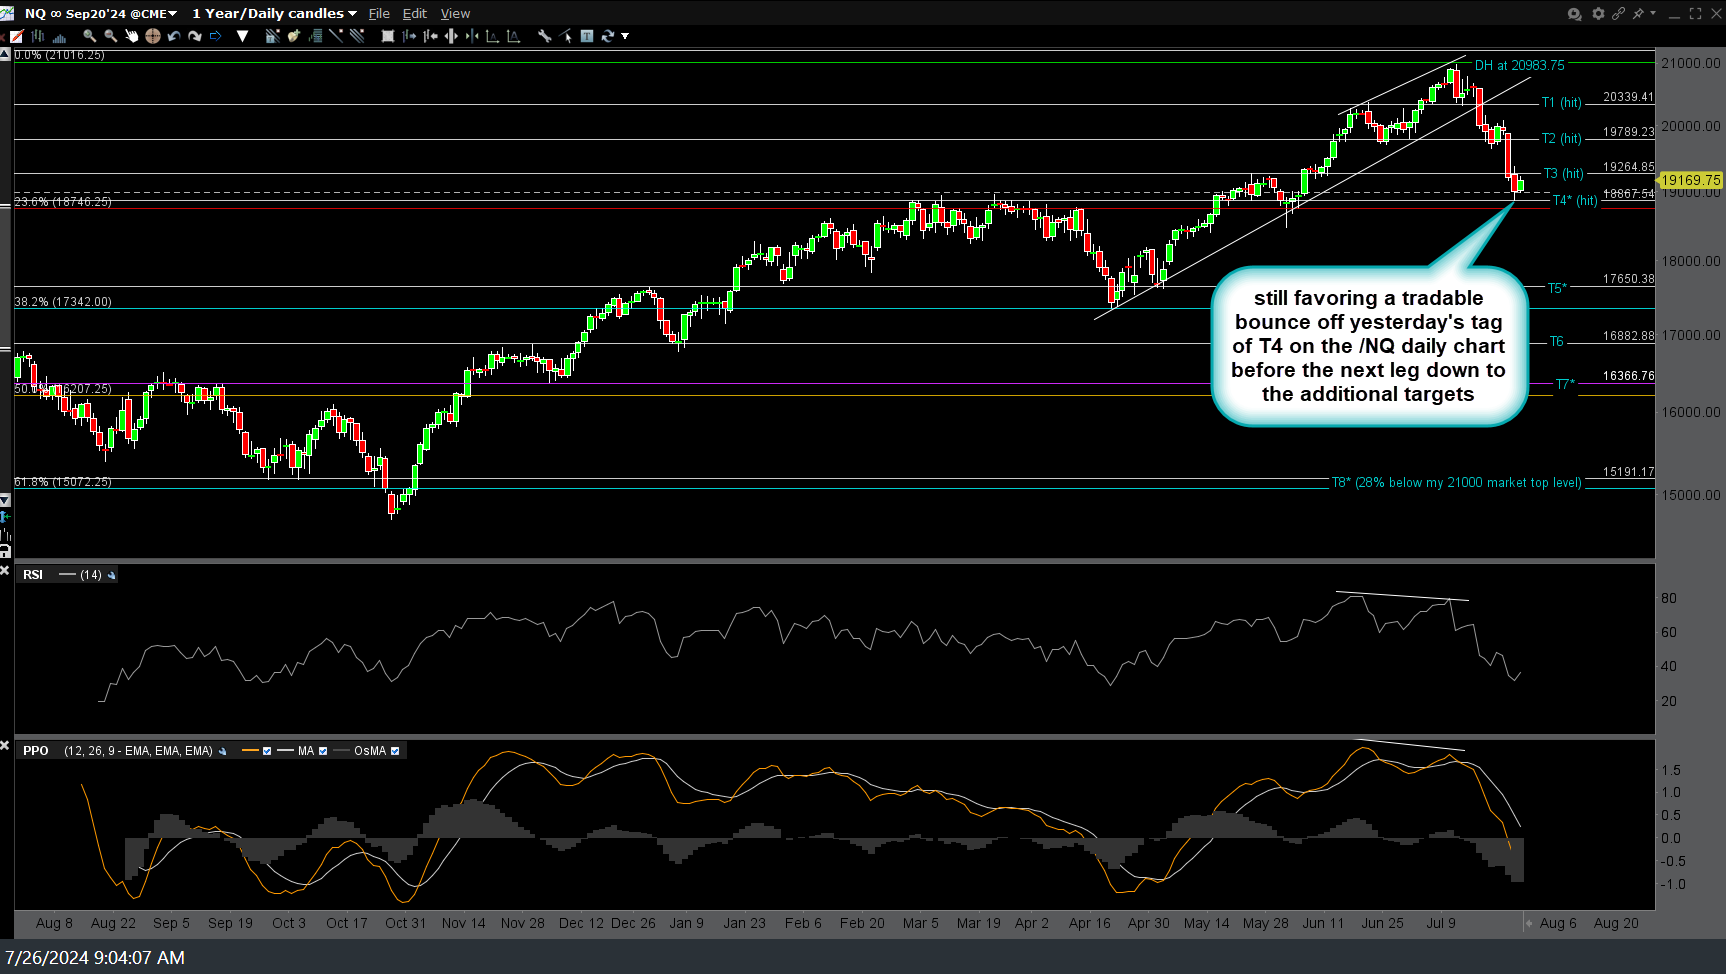
NQ daily July 26th
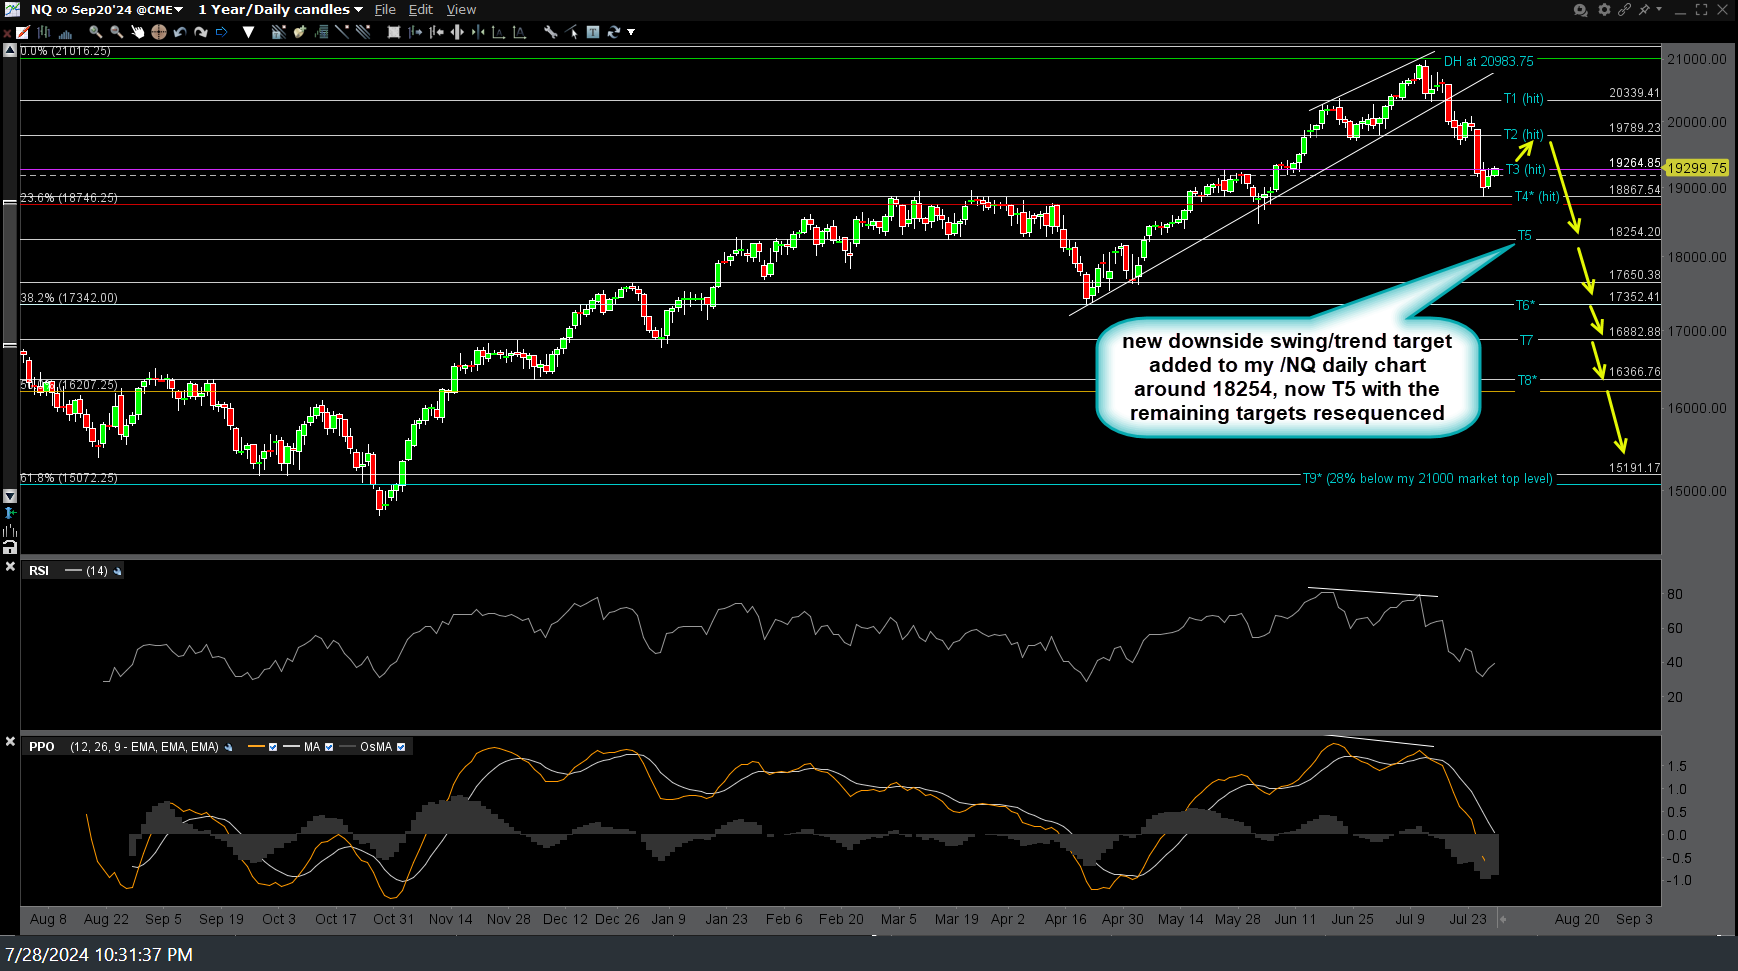
NQ daily July 28th
The next update posted with the daily chart of /NQ was in the pre-market session on the morning of August 5th, as global stock markets around the world were plunging & even outright crashing (Nikkei down 12% for its largest point loss in history). As I make the screenshot & fired off that post, /NQ had just hit the same T6 price target that was laid out in advance the day before the Nasdsaq futures peaked. In that post & in the accompanying comment section below, without any ambiguity or mixing of words, I stated: “In addition to the long-term swing targets on QQQ, SPY, & NVDA being hit in pre-market today as per the previous post, /NQ (Nasdaq 100 futures) also just hit my 6th long-term swing target (T6), going literally just 1 point (on a nearly 18,000 point security) below that 17352 target. Close enough for government work & close enough for a hard reversal (as mentioned in the previous post) across all accounts (long-term accounts & active trading account).”
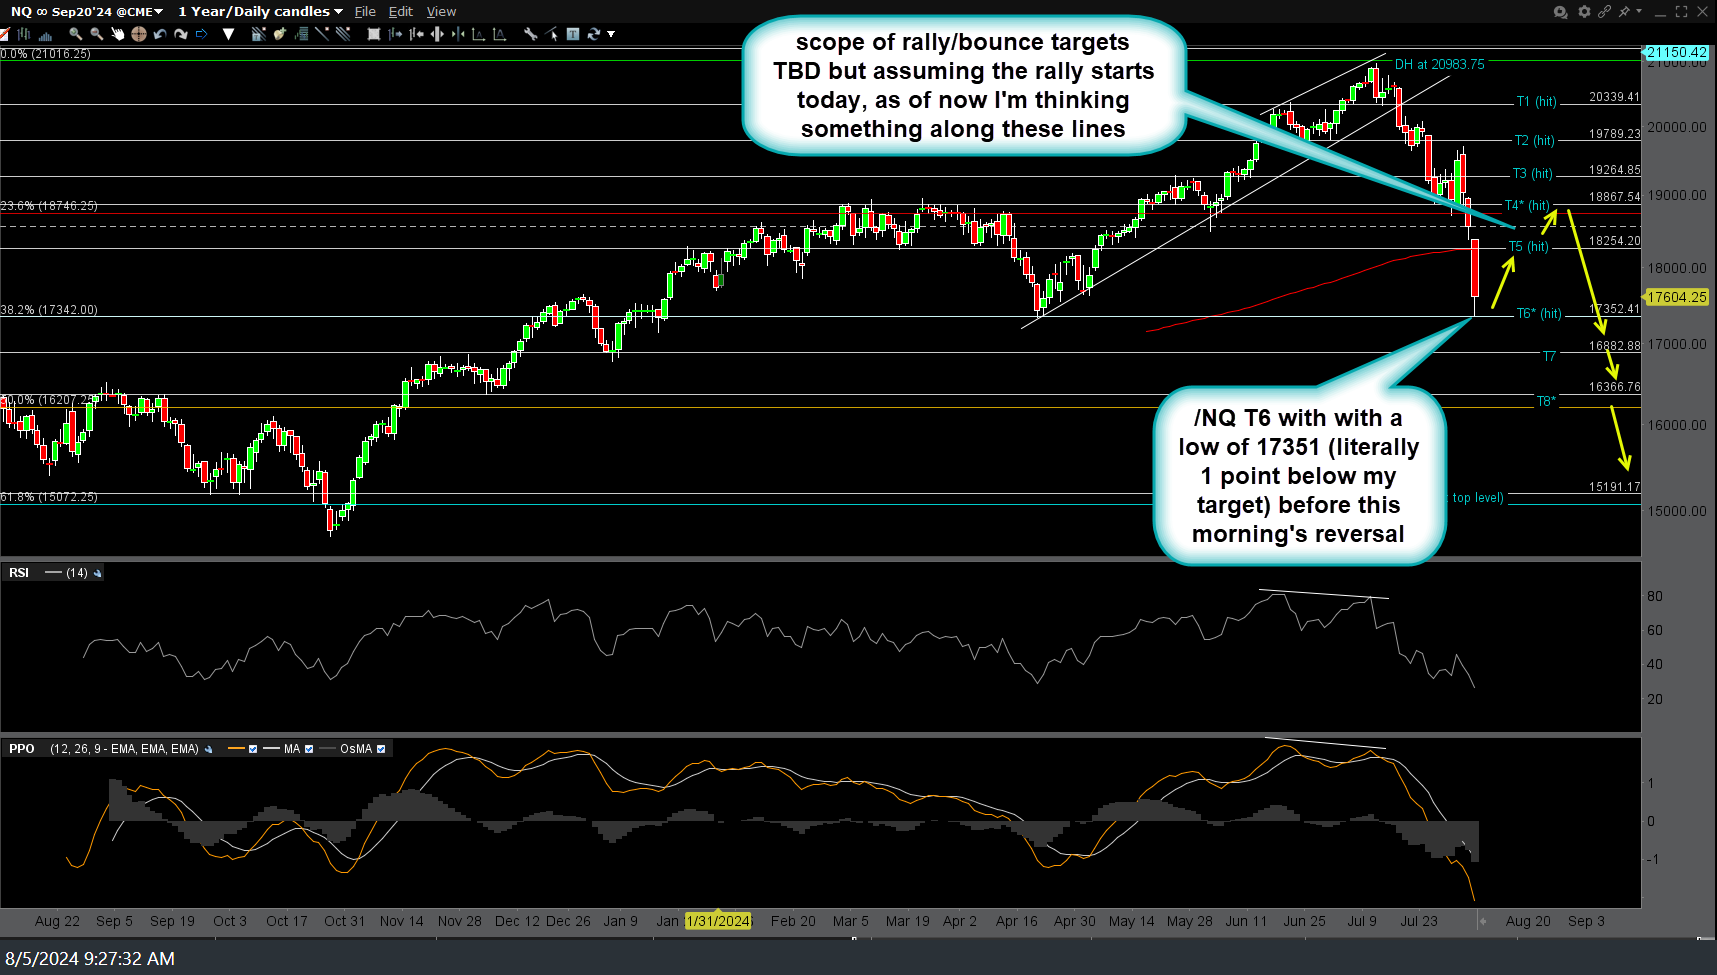
NQ daily Aug 5th
That precise “hard reversal” of covering all shorts & immediately going to a full long position proved extreme timely & profitable. While there have been plenty of active trading opps, both long & short, posted using the intraday charts since then, this is the first time that I have posted an update on the longer-term trend trade on /NQ via the daily chart. /NQ now offers objective short entry on backtest of primary downtrend line off the July 11th top with stops commensurate with one’s preferred price target(s), using a favorable R/R of 3:1 or better. I’ve also shared my personal stop preference & trading plan in recent videos. Updated daily chart below.
NQ daily Sept 13th
A couple of related points worth reiterating:
- With the “ginormously” anticipated FOMC rate decision (will it be 25 or 50bp?; How will the market react? Has the market already priced in most, all, or more than upcoming rate cut…or not enough?, etc..), the odds of whipsaws (i.e.- false breakouts/breakdowns through support & resistance levels) is quite elevated IMO. As such, one needs to decide whether they should go flat (close positions), lighten up, sit tight & stay disciplined or decide to widen stops to allow for what is likely to be pre & post-FOMC “noise” (i.e.- volatility).
- While so far, the longer-term, bigger picture call on; A) Where the Nasdaq 100 would be going (and has gone) and even better; B) How it will get there (i.e.- the counter-trend rallies to game the bounces along the way) has played out about as good as one could expect, the only certainty going forward is that just about all securities (stock, index, commodity, ETF, etc..) I’ve ever traded with impunity (long/short/long/short, etc..) while milking the bulk of both the larger, primary trend as well as many or all of the smaller counter-trends within, has a limited duration before my style & sync with the charts stops working.
- At best, I recognize when that point is likely to (or just has) come & I’m able to close out the trade at my final target & then wait patiently for the charts to set up (with my type of setup) later down the road …or…
- All of a sudden, or worse, after several failed trades (wrong/out-of-sync analysis), it becomes apparent that I am reading the tea leaves (charts) wrong, in which case, the sooner I recognize that, the better. As such, DYODD & only take trades that mesh with your own outlook for that security, your own risk-tolerance, & your own unique trading style.
- With that whole & very much expected (as per my comments at the Aug 5th bottom), “market participants will soon get giddy about the impending rate cuts” (and they still are) & while it is not my current expectation, I would be very far from surprised if the Nasdaq 100 goes on to solidly take out the downtrend line & makes a run at a new high. Again, that is not my current expectation but as I like to say, the charts are dynamic & therefore, so is my analysis. As of now, resistance is resistance until & unless taken out.
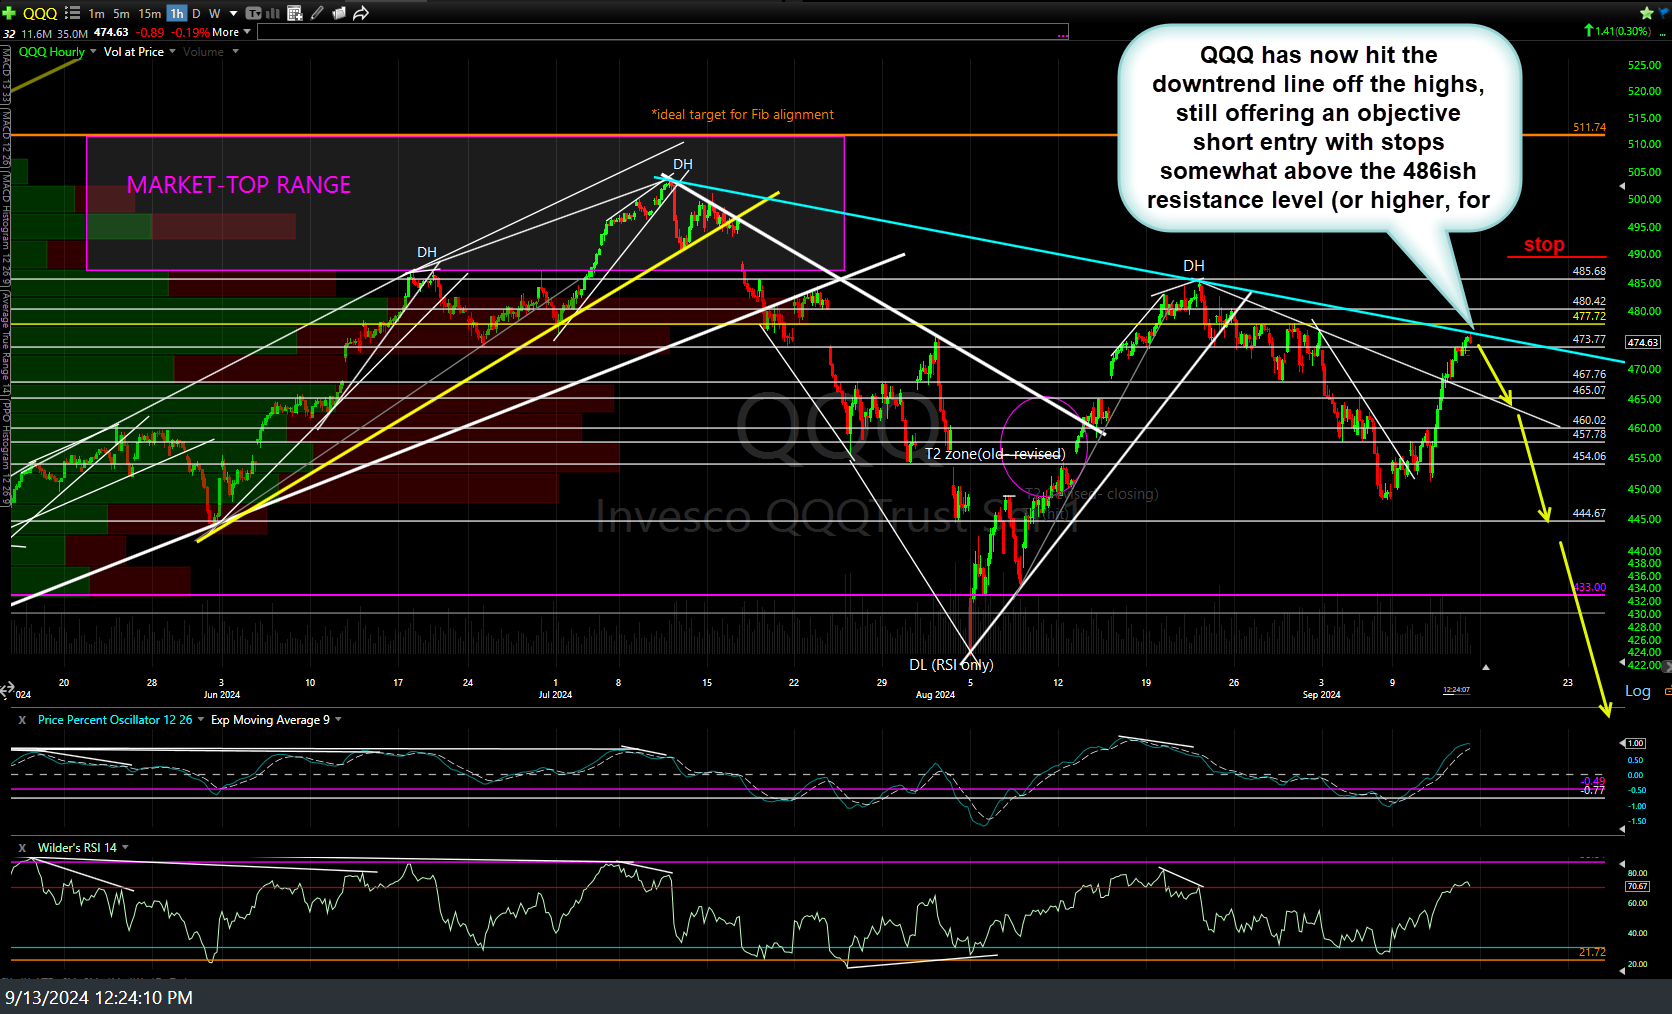
- Updated QQQ 60-minute chart below for reference, as it has now made a full tag of the downtrend line off the highs (was slightly below it in the previous charts I posted earlier today & yesterday).

QQQ 60m 2 Sept 13th