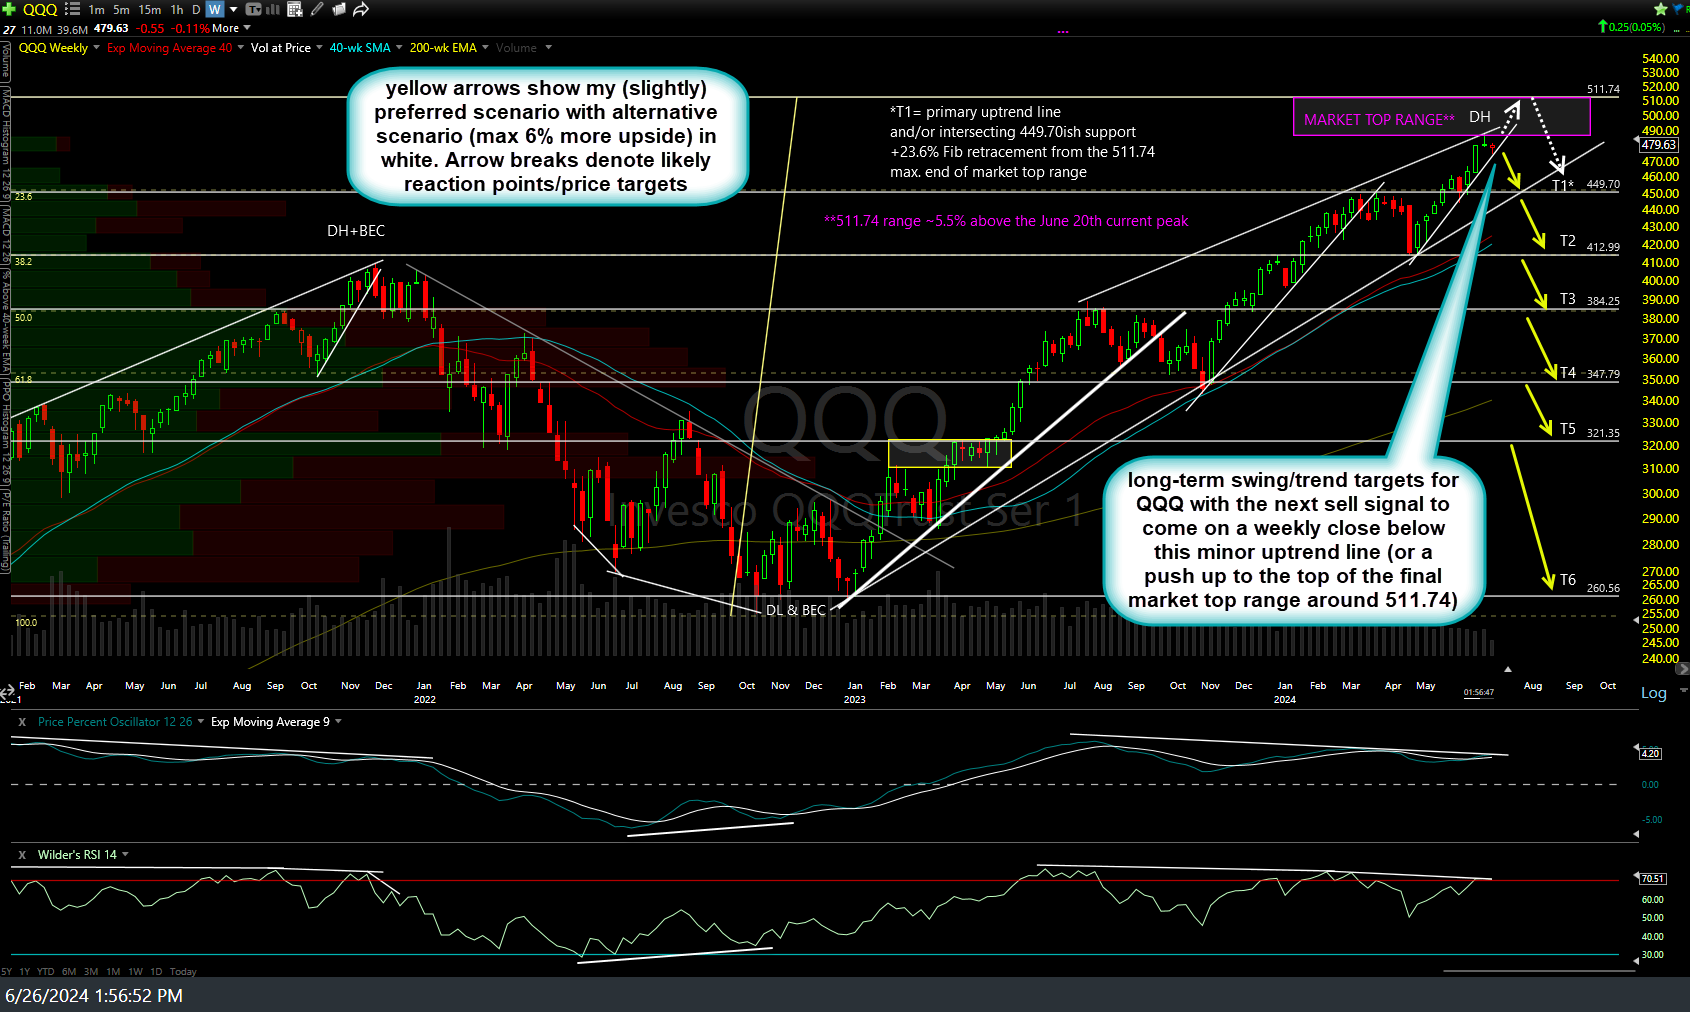
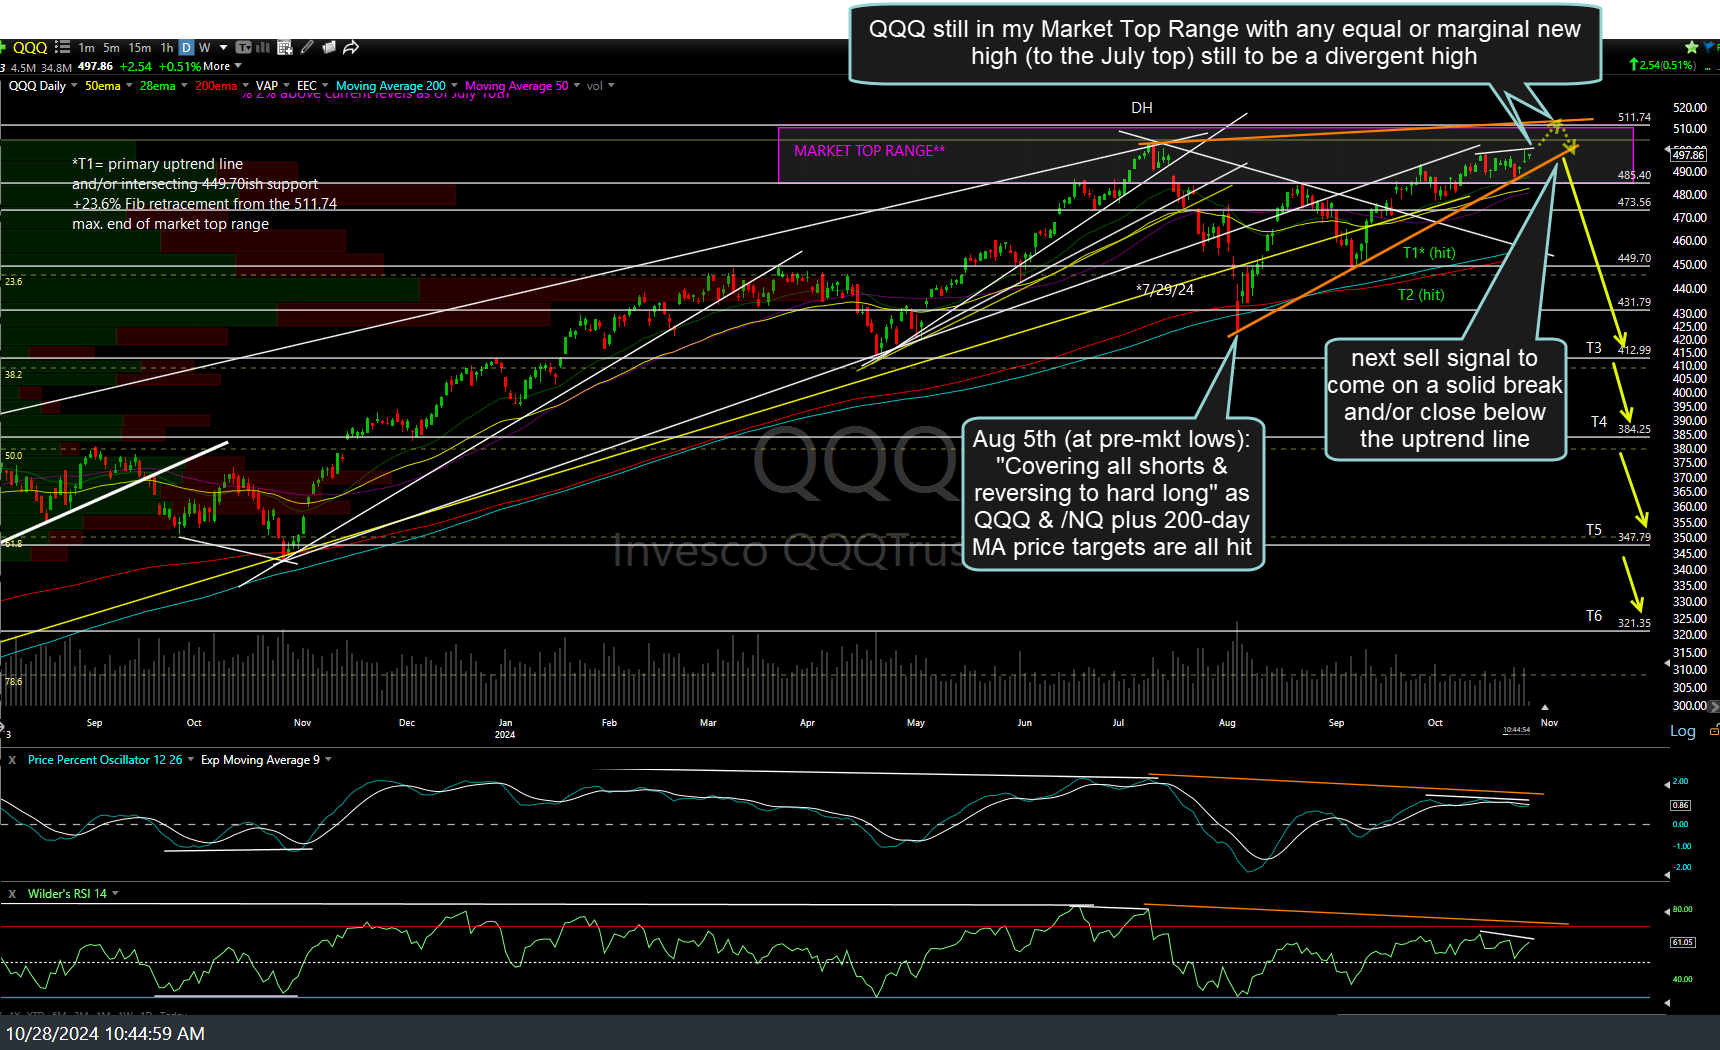
QQQ (Nasdaq 100 ETF) remains in my “Market Top Range” first laid out on June 26th (first chart below) with any equal or marginal new high (to the July top) still to be a divergent high. June 26th weekly chart followed by the updated daily chart (with same long-term swing/trend targets) below.
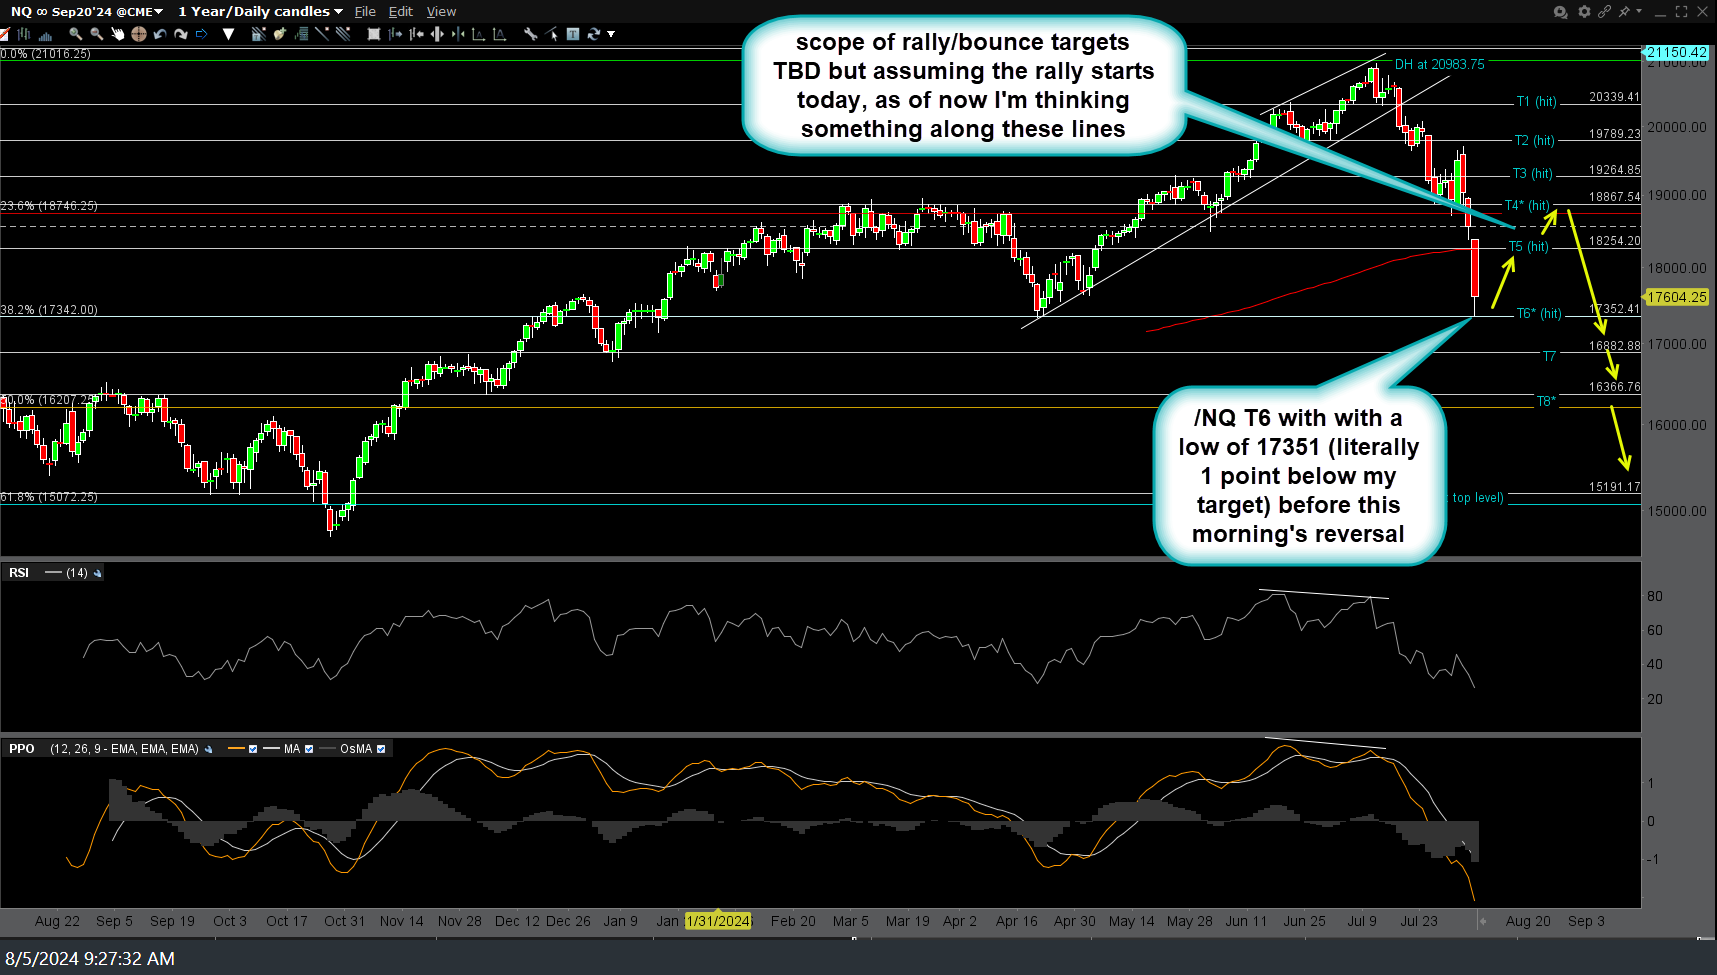
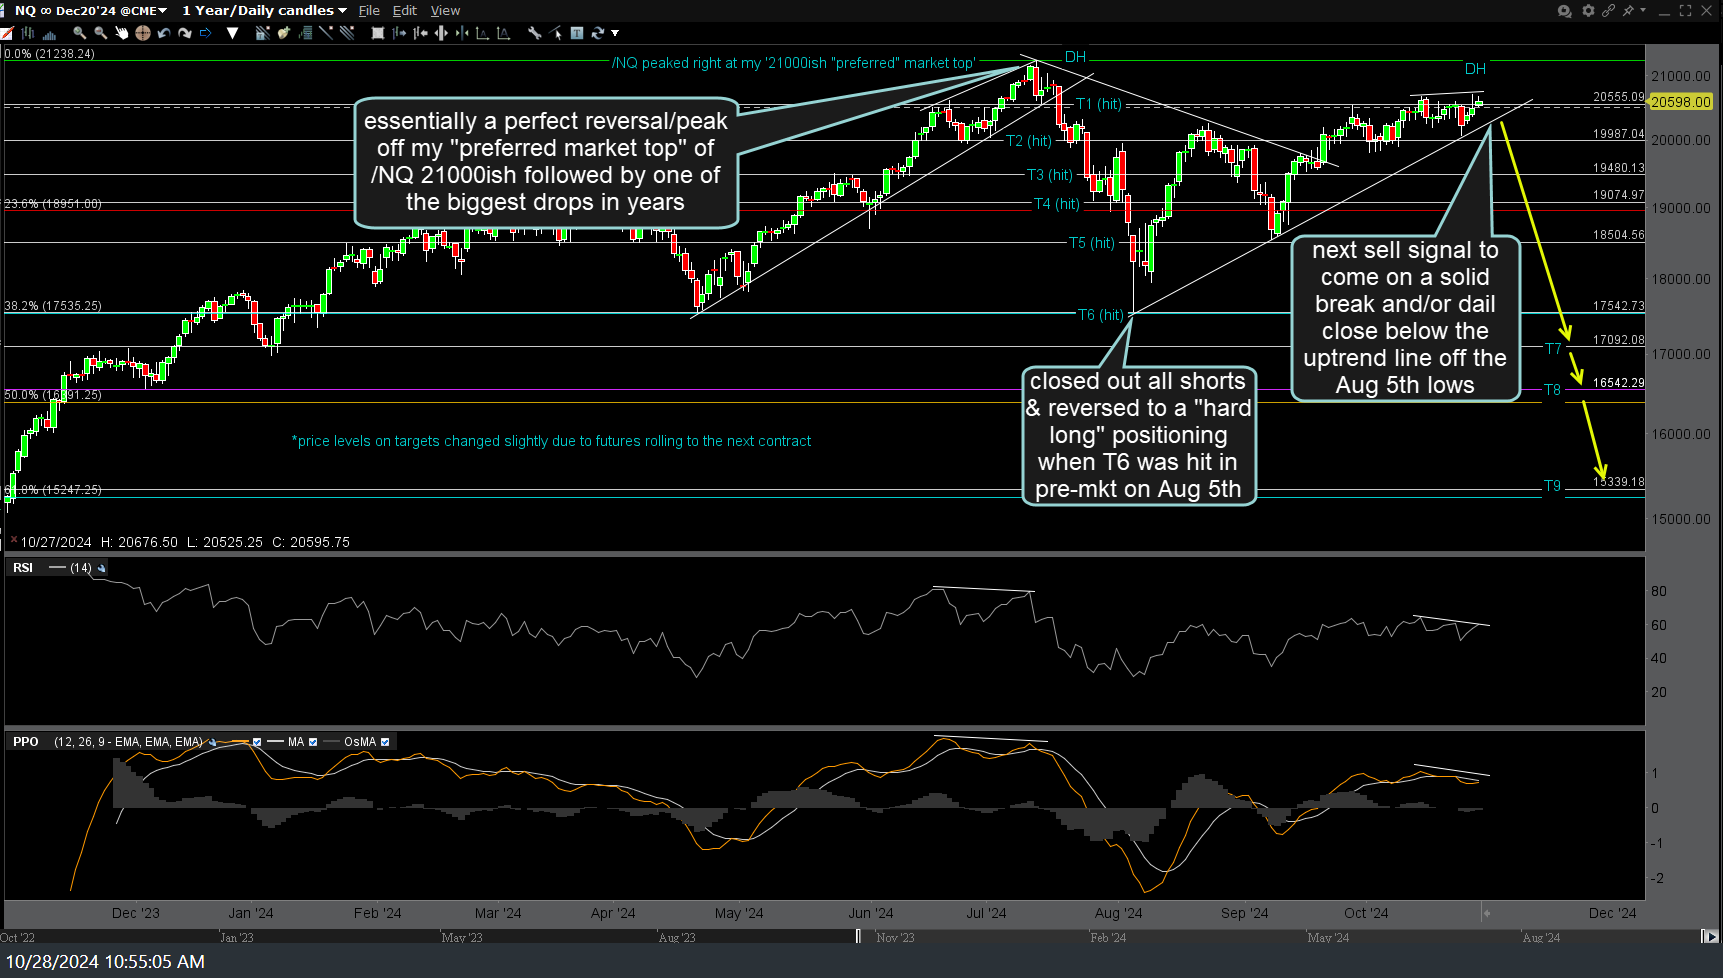
Back on July 10th, the very day that QQQ peaked & just one day before /NQ (Nasdaq 100 futures) peaked, I posted /NQ as a short entry at that level & “up to but not above the 2100ish ideal market top level”. /NQ carried slightly higher into the following day, peaking right at my preferred market top level followed by the 17% drop into the Aug 5th lows where we covered all shorts & reversed to a full long positioning.
Bottom line: With /NQ & QQQ once again just shy of the top of my market top ranges, they offer objective short entries with objective add-ons or alternative (more conservative/higher-probability) entries to come on solid breaks below the primary uptrend lines off the August 5th lows in both /NQ & QQQ with stops commensurate with one’s preferred price target(s).
Keep in mind this is essentially peak-earnings week with the majority of the market-leading big tech companies reporting (GOOGL, MSFT, META, AMZN, AAPL, INTC, AMD, etc.) or already reported last week (TSLA). As such, volatility is about all but certain this week & that can go either (or both) way(s). As such, one might consider keeping position sizes relatively small until next week which can help allow for wider stops (to help avoid getting your stops clipped in the volatility).
It has also been my experience that whipsaws (false breakouts) are more common during this historically volatility peak-earnings week & as such, all but the most nimble & active traders might opt to keep things light this week & wait to see which direction the market wants to go after the slew of big earnings reports this week.


