
Just another reminder that this week is likely to be marked with increased volatility as we round out peak earnings week with reports from META, MSFT, AAPL, AMZN, & more. It seems like forever since we had a half-decent sell signal on the Nasdaq 100 although here are the intraday charts with some levels that “should” do the trick:
QQQ sell signal to come on a solid break and/or close below this uptrend line on the 60-minute chart below.
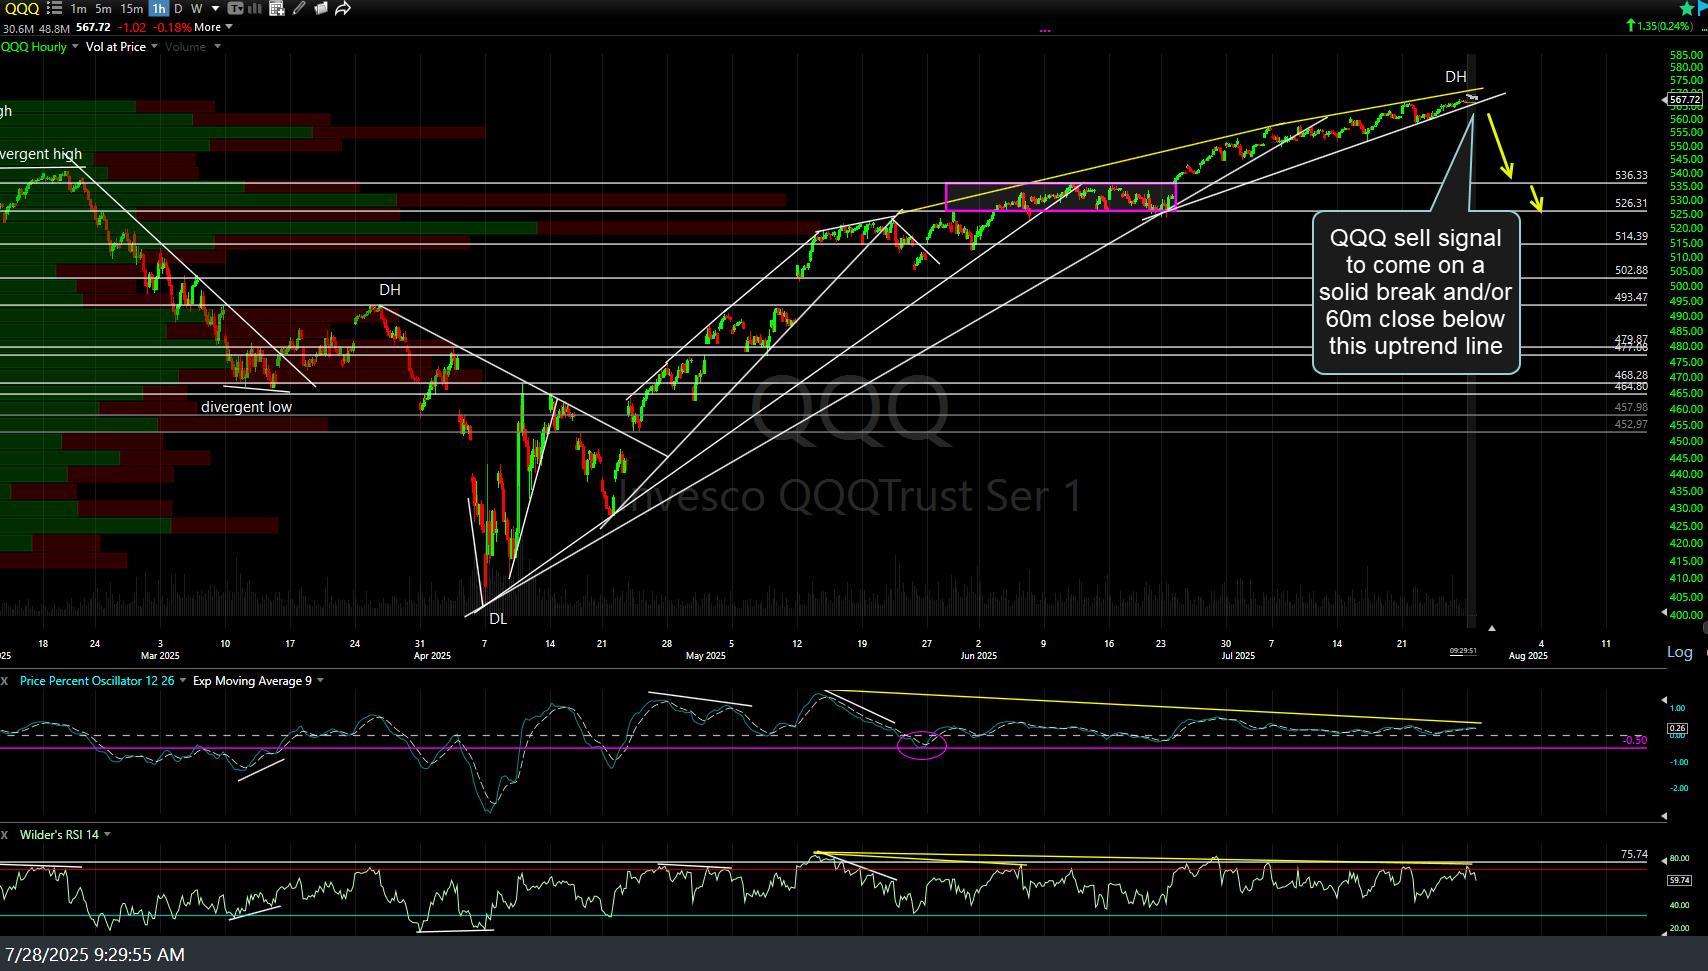
QQQ 60m July 28th
Likewise, /NQ (Nasdaq 100 futures) sell signal to come on a solid break and/or 120-minute close below this uptrend line (2-hr chart).
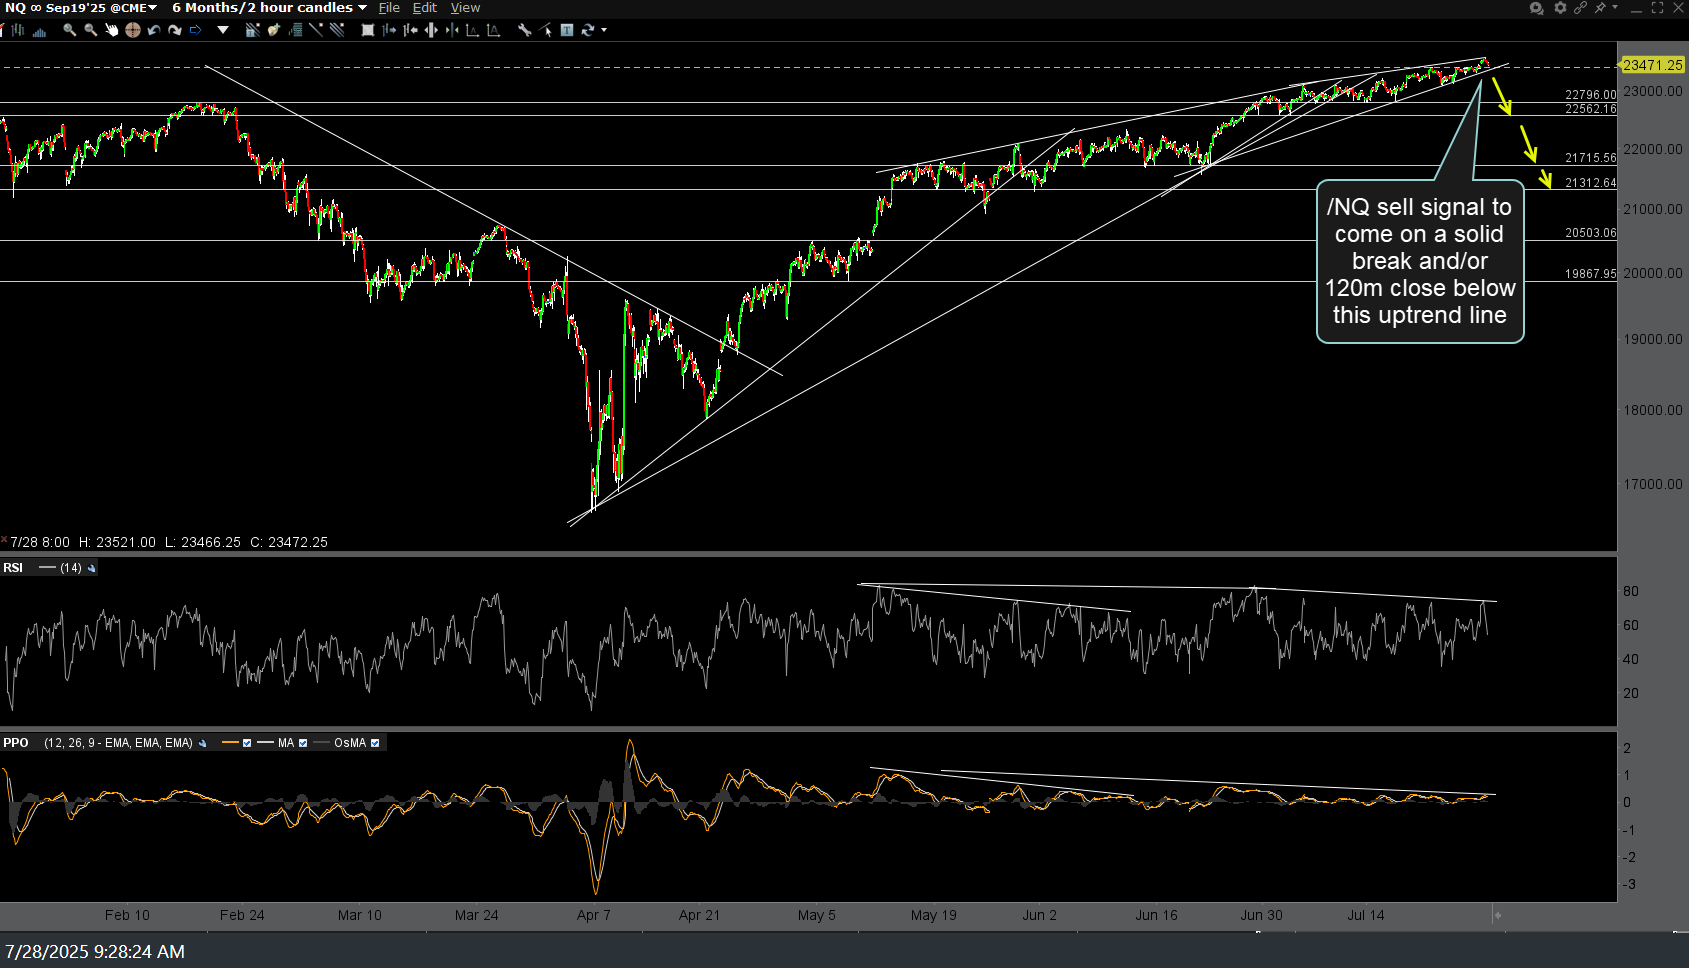
NQ 120m July 28th
Of course, no change in the longer-term charts since covered last week & I will be updating the long-term indicators on the monthly charts once the July candlesticks are finalized after Thursday’s close, although preferably Friday’s (Aug 1st) closing sticks this time around due to the post-earnings moves after AMZN & APPL report after the close on Thursday.