
As per the previous 60-minute chart posted yesterday, I’m still awaiting solid 60-minute breakouts (i.e.- solid 60-minute candlestick closes) above the 11290 & 11535 levels for buy signals on /NQ & QQQ.
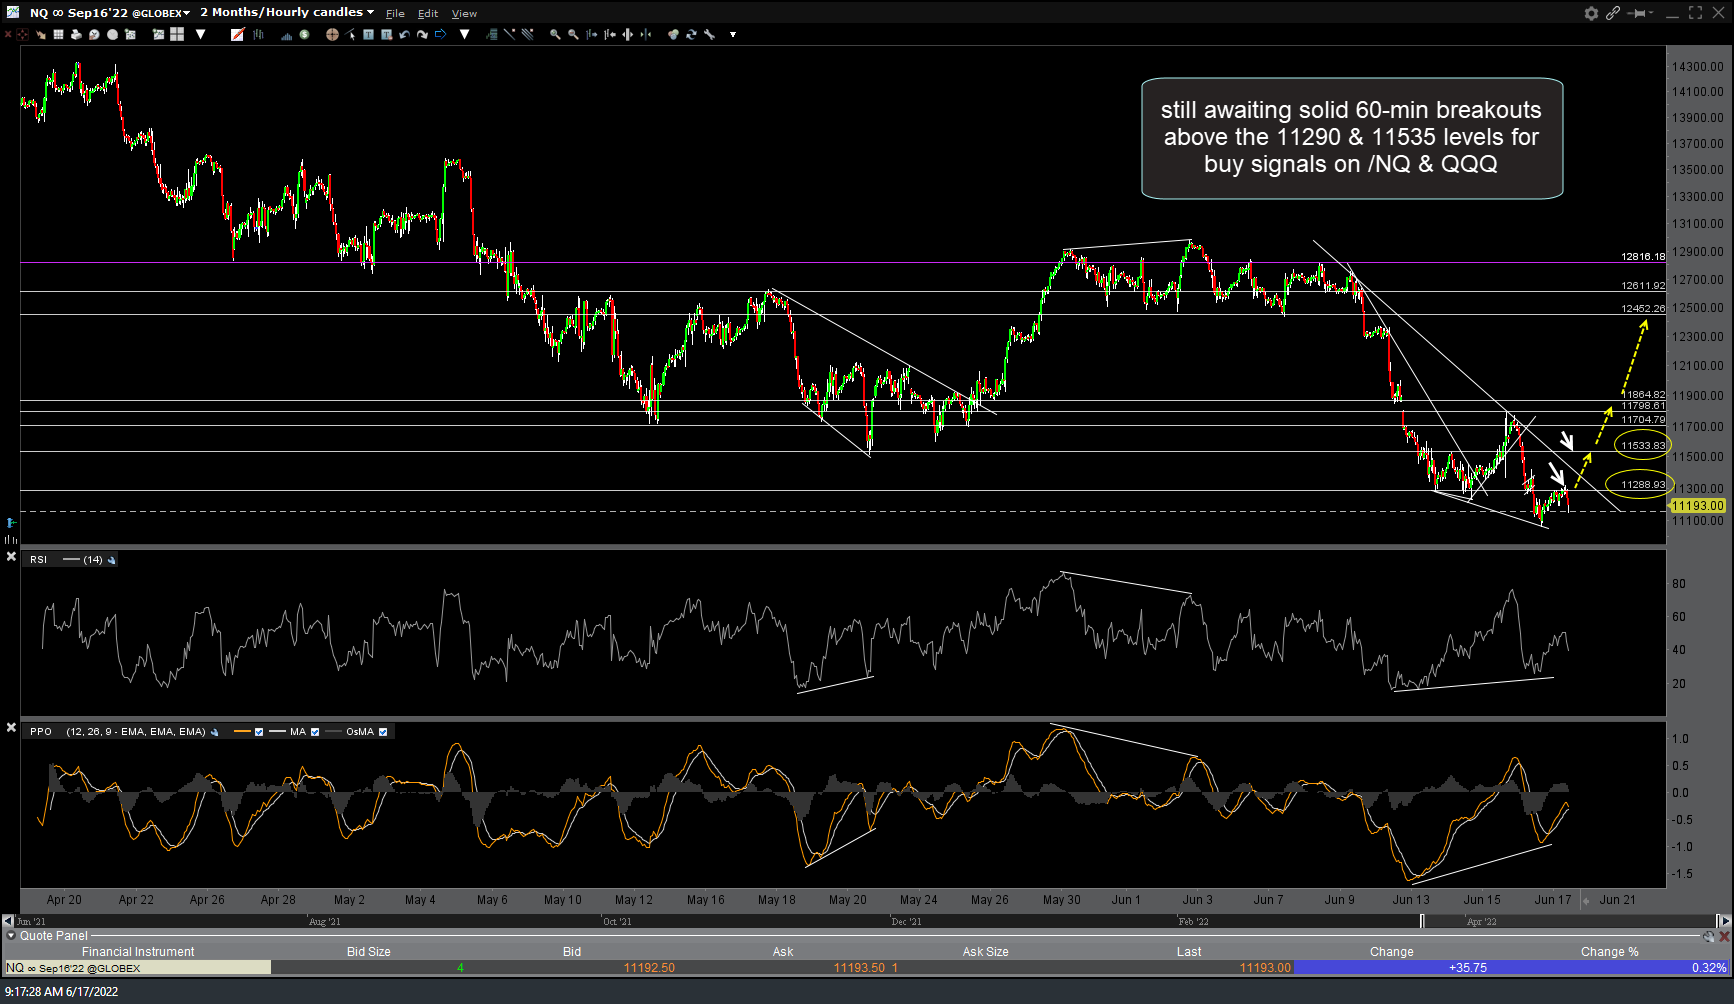
NQ 60m June 17th
While the Nasdaq 100 remains in a solid downtrend without any buy signals at this time (although still at long-term support/T3 on the weekly chart), a case could be made for an objective long entry/add-on here at the 11160 support on this 1%+ pre-market pullback that was triggered by the breakdown of this small bearish rising wedge pattern on the 5-minute time frame (the wedge was confirmed with negative divergence).

NQ 5m June 17th
Again, we don’t have anything remotely close to a buy signal or evidence of a reversal in the stock market as at this time, in fact, we are solidly entrenched in one of the most impulsive downtrends in decades. As such, depending on one’s outlook for the market from here as well as their trading style (i.e.- are you aggressive & like to try and nail tops & bottoms or do you prefer to wait for solid buy signals before covering shorts & going long during a downtrend) a case can be made to cover all shorts and/or start scaling in long here at support with divergences building on multiple time frames (thereby increasing the odds of a trend reversal ) & a case can also be made to stay short while lowering stops to protect profits if swing/trend trading the indexes short while targeting the next downside trend targets.
FWIW, my preference remains the former & if I’m wrong, that will most likely become apparent by the close of today or early next week.