
Ever-so-slightly, as I type, but /NQ is starting to crack below the uptrend line, thereby triggering the next objective short entry or add-on. The previous chart I posted on the initial entry above the trendline this morning was incorrectly listed as a 60-minute chart while it was actually a 120-minute chart (2-hour candlesticks). Either way, the 60m & 120m charts are very similar & here’s the 60-minute chart showing the trendline starting to crack, albeit by only a slight margin so far & not yet finalized with a 60 or 120-minute candlestick close below it.
As I suspect the selling could come fast & furious due to all the hot air that is likely to come out of the Q’s with a crowded rush for the exits, quite likely with an overnight drop in the futures leading to a gap down tomorrow, I wanted to get this out early, even at the risk of it potentially proving to be a whipsaw.

NQ 60m May 20th
Likewise, QQQ is also just starting to crack below the uptrend line, thereby triggering the next objective add-on or new short entry.
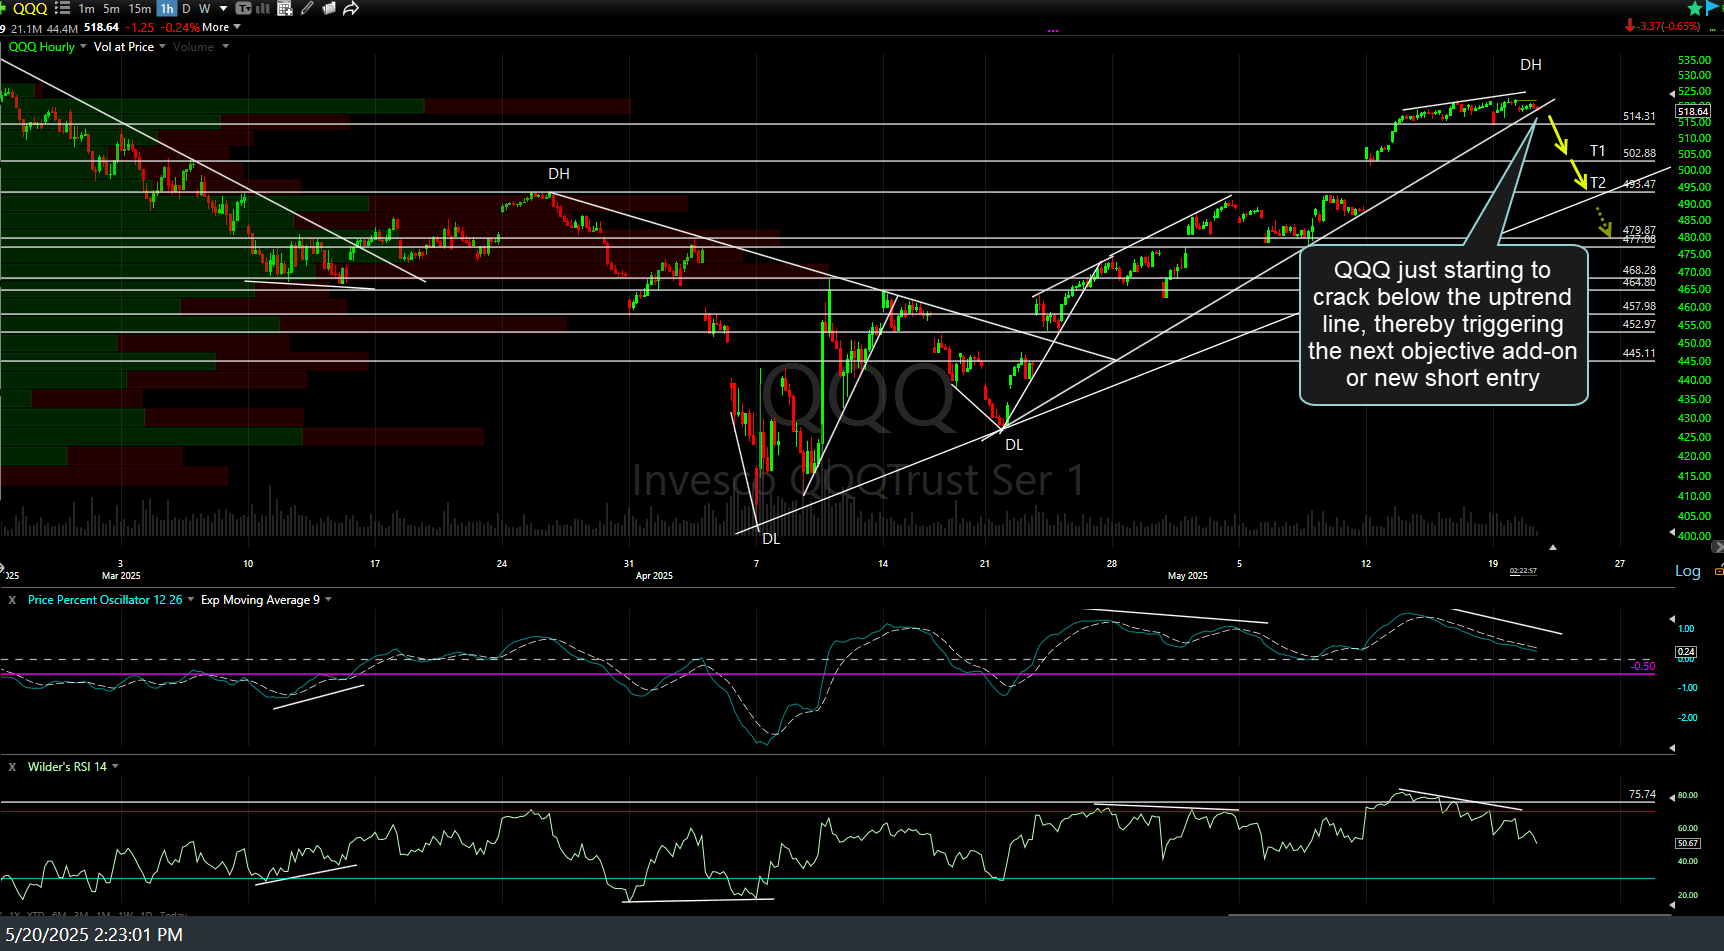
QQQ 60m 2 May 20th
On a somewhat related note (due to its high correlation to the tech-heavy Nasdaq 100), here’s an update on the PLTR swing trade I just posted in a comment reply earlier today for those interested: https://rightsideofthechart.com/swing-trade-ideas-5-20-25/#comment-35948