
My /NQ (Nasdaq 100 futures) downtrend line bounce target on the 15-minute chart has just been hit in the pre-market session. Closing the long & reversing back to short for a quick pullback trade. Previous & updated 15-minute charts below.
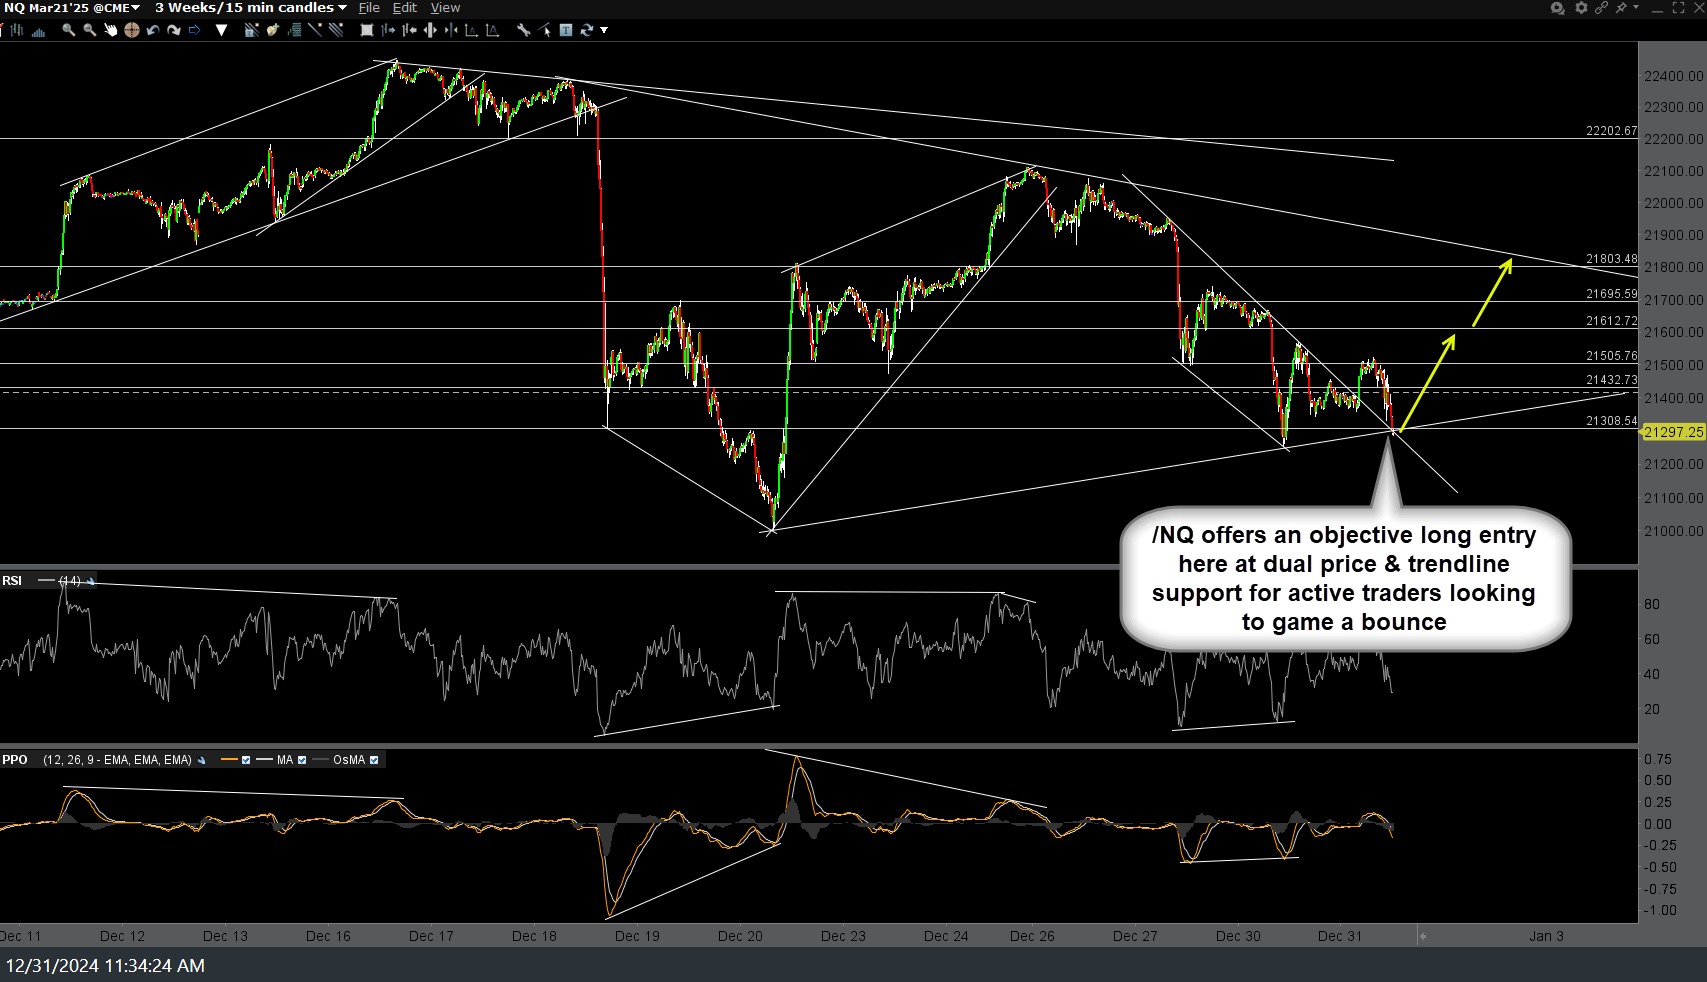
NQ 15m Dec 31st
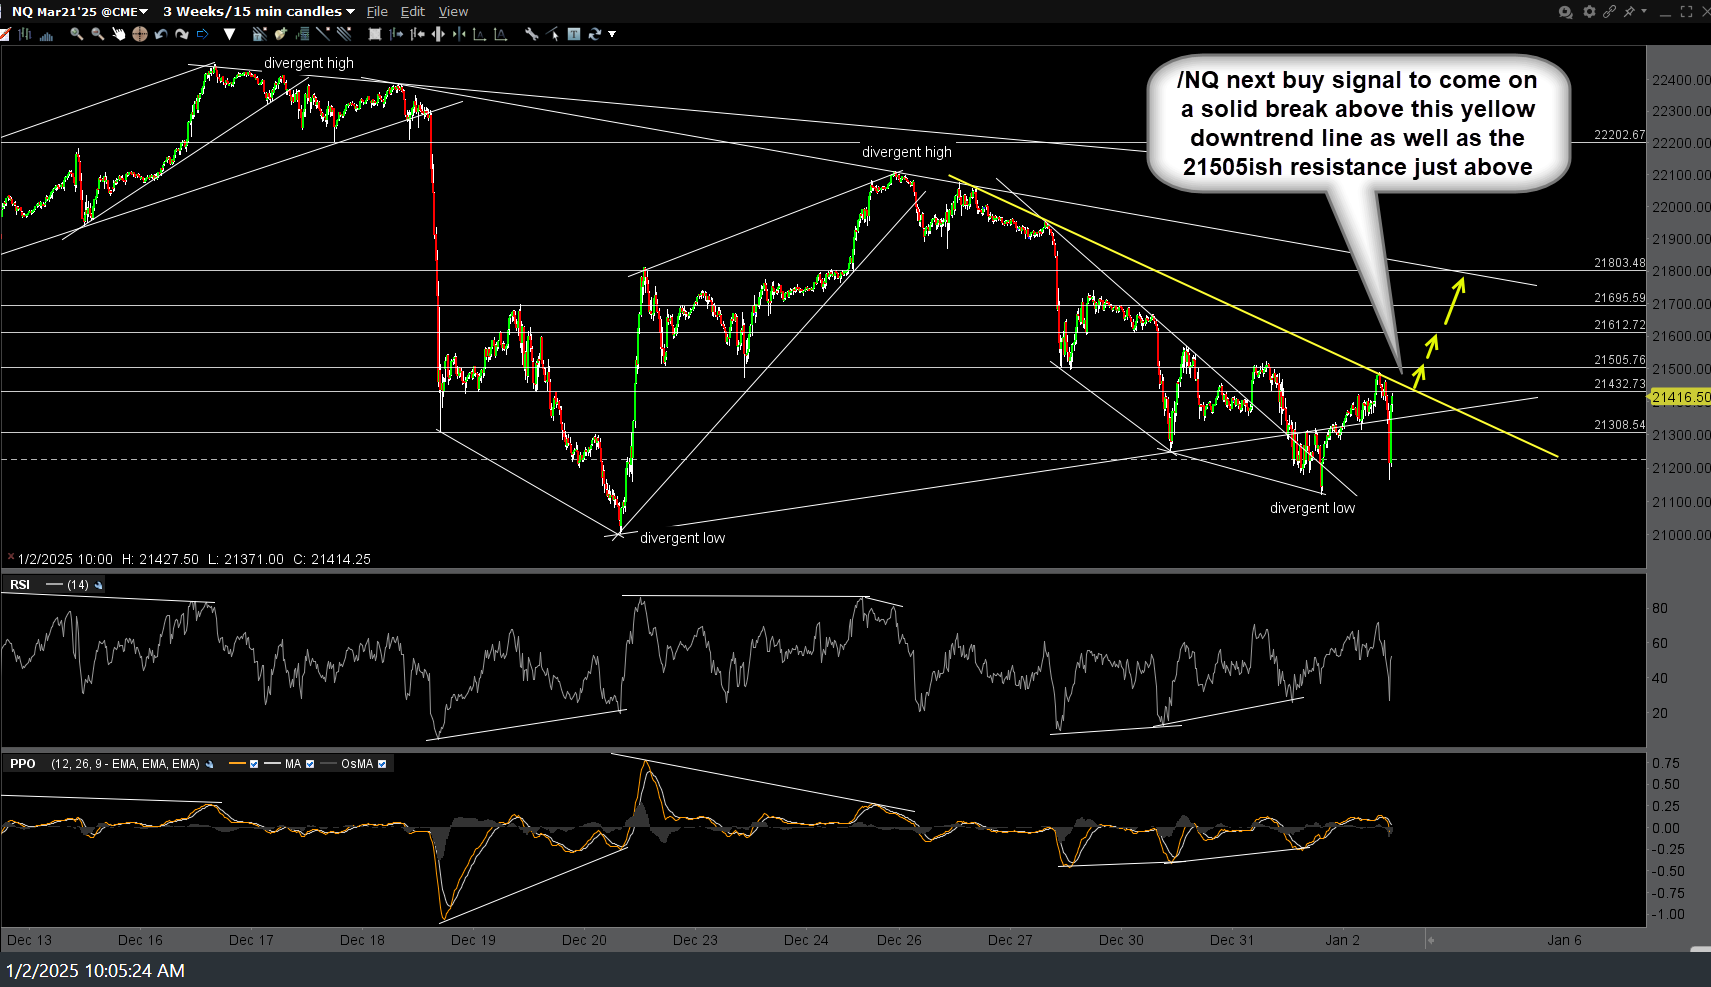
NQ 15m Jan 2nd
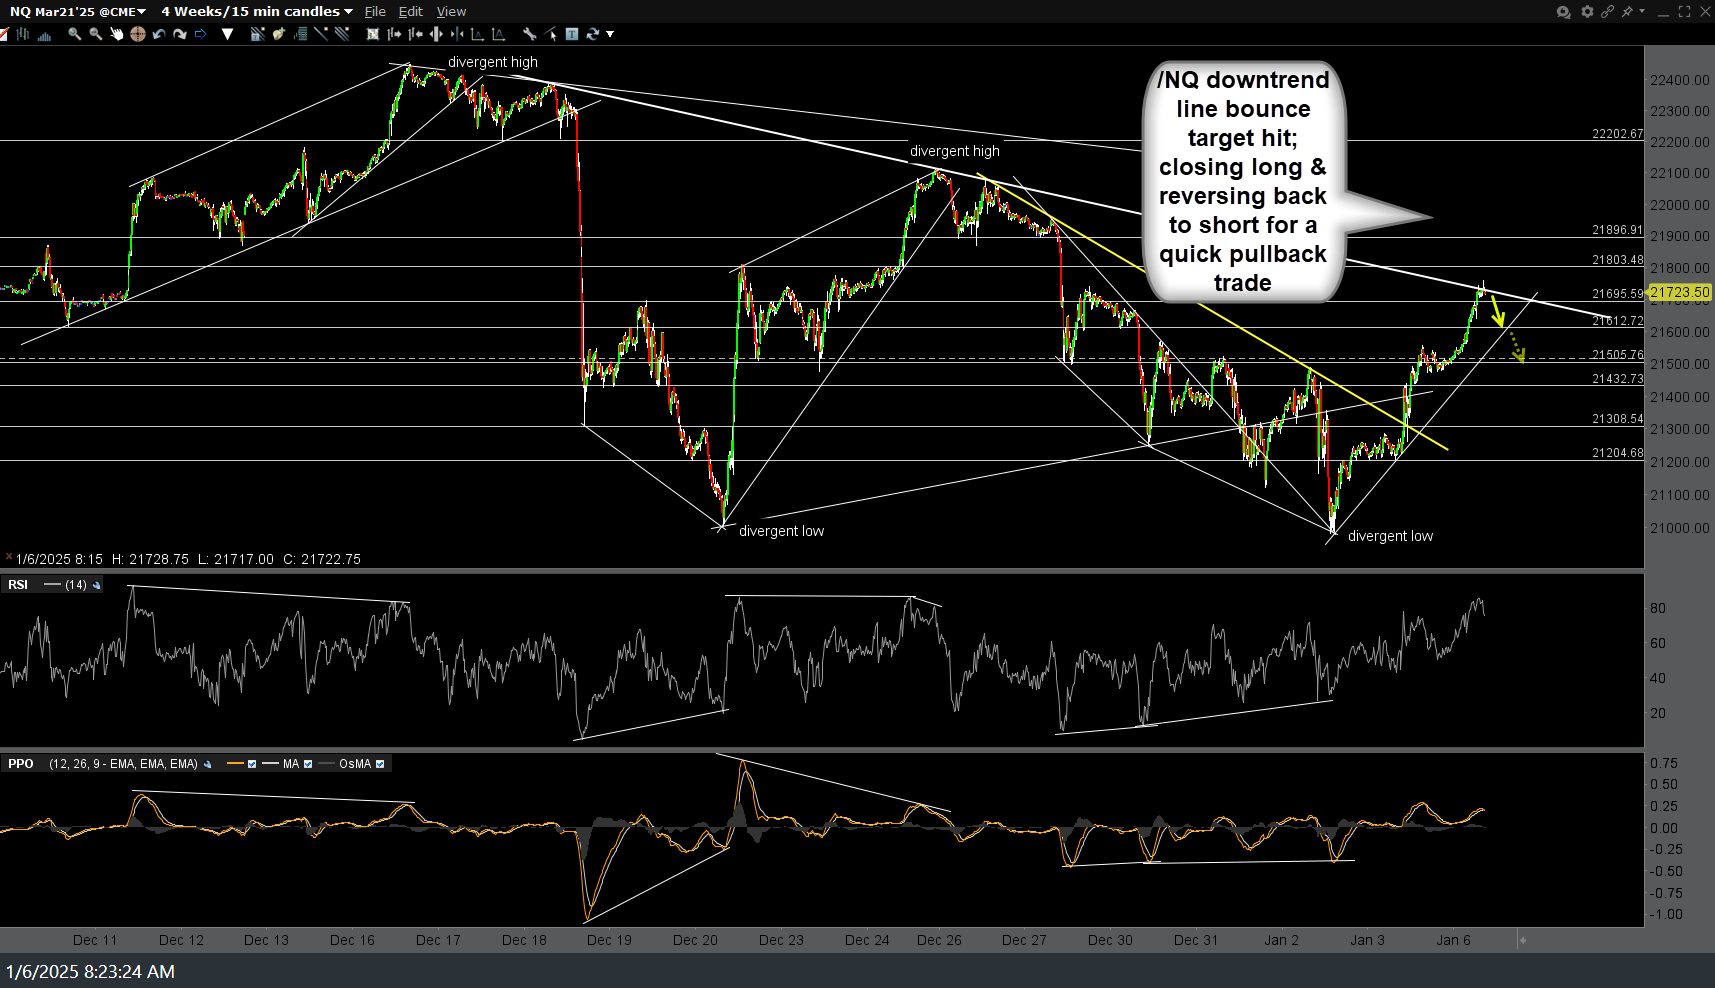
NQ 15m Jan 6th
QQQ (Nasdaq 100 ETF) has also hit comparable downtrend line + 524.83 price resistance, offering an objective level for active traders to book profits and/or reverse to short for a quick pullback trade. Previous & updated 15-minute charts below.
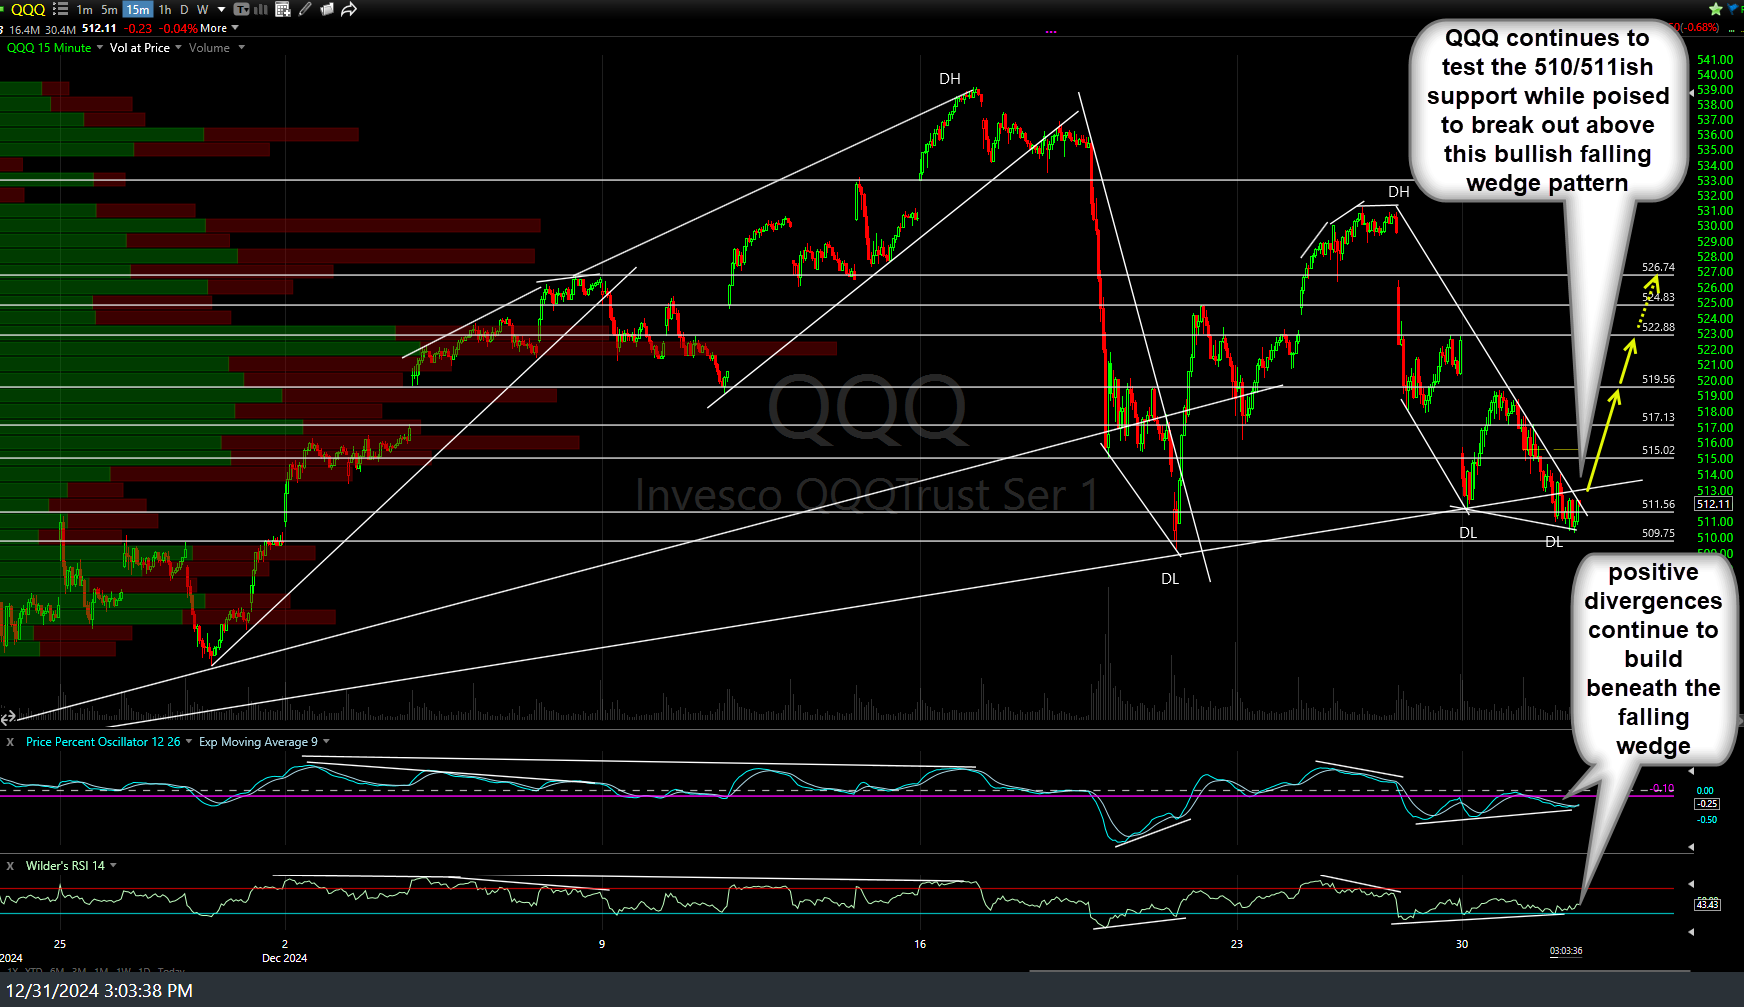
QQQ 15m 3 Dec 31st
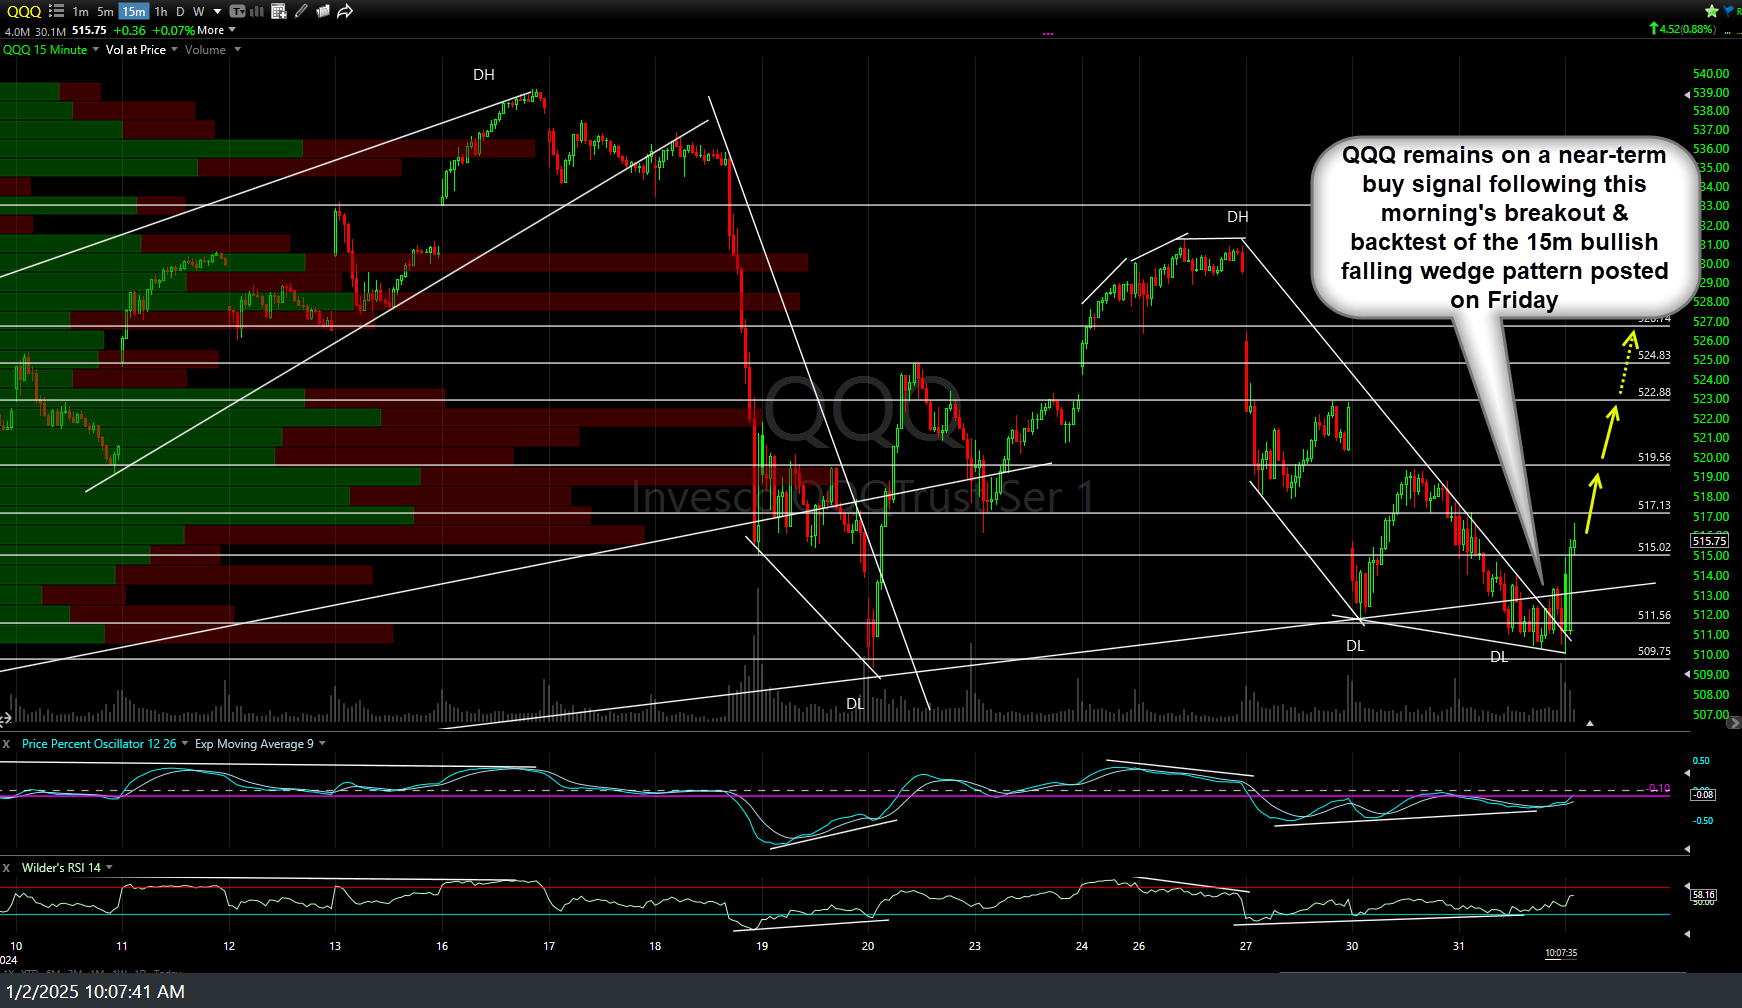
QQQ 15m Jan 2nd
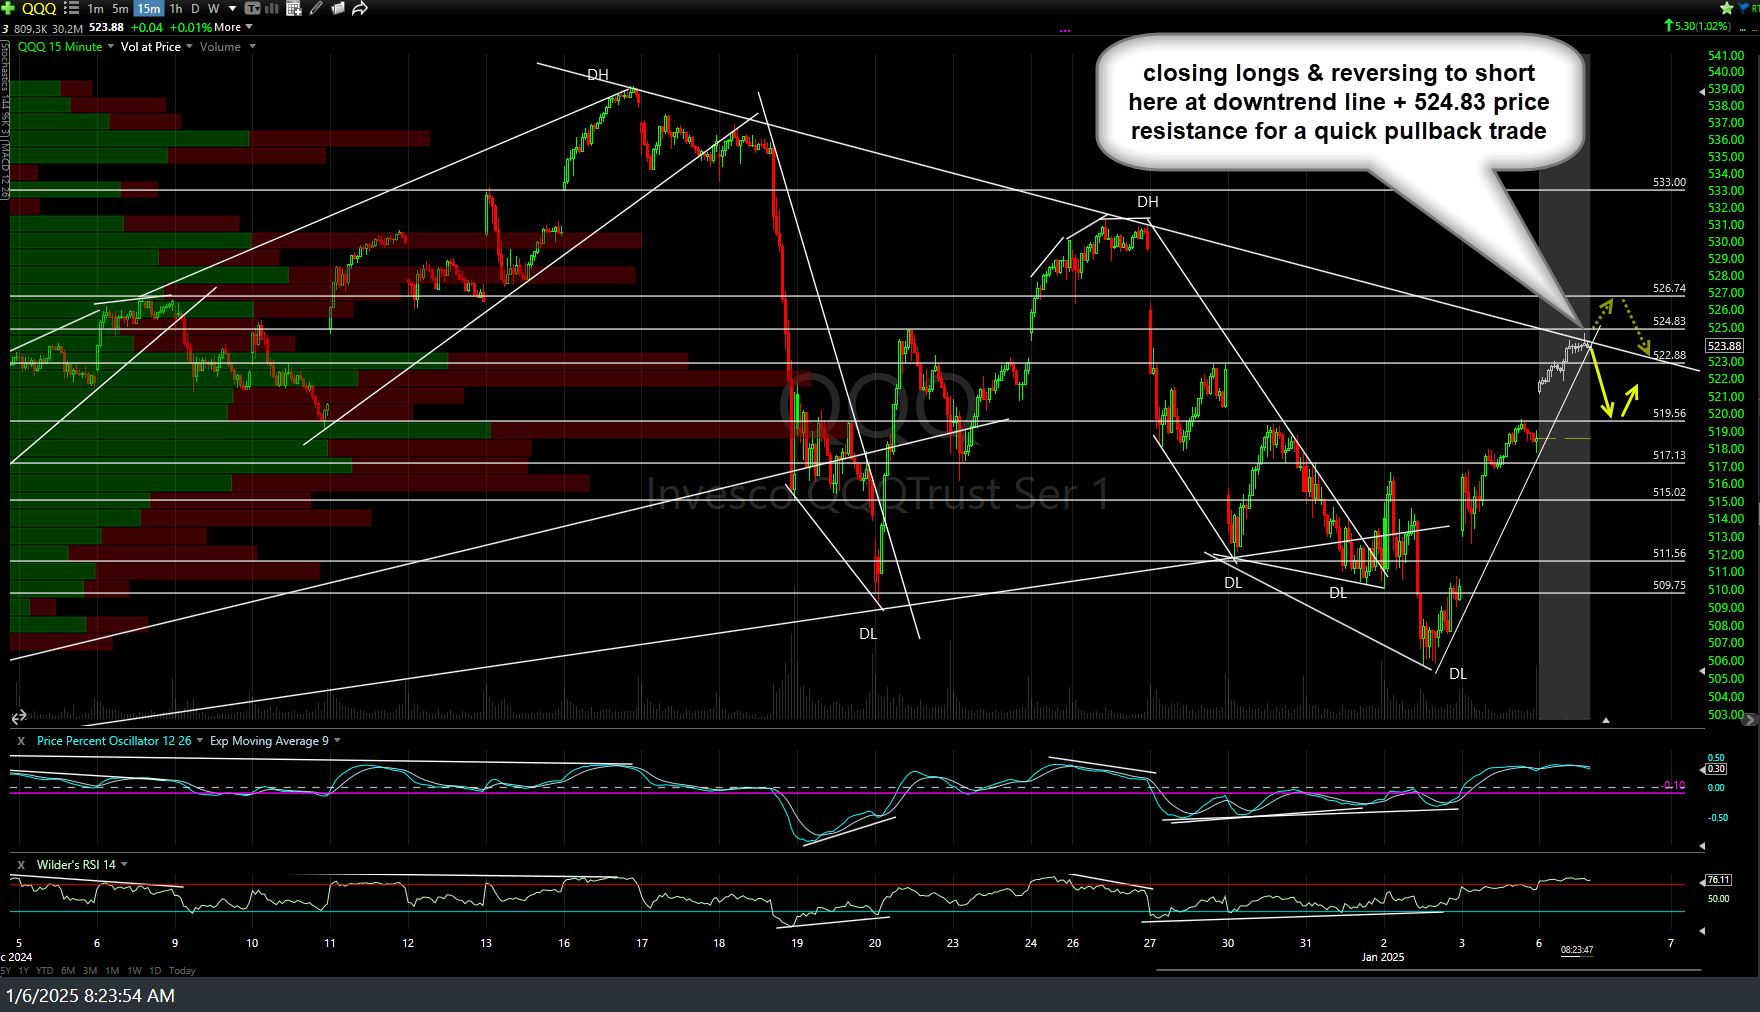
QQQ 15m Jan 6th
It is most certainly worth noting that this is also the first divergent low on the more significant 60-minute time frame on QQQ & /NQ in a while & has the potential to be the catalyst for new highs/double-digit gain on QQQ so staying flexible for now while remaining in active trading mode. QQQ 60-minute chart, with the Q’s at the top of what could be a bullish falling wedge, below.
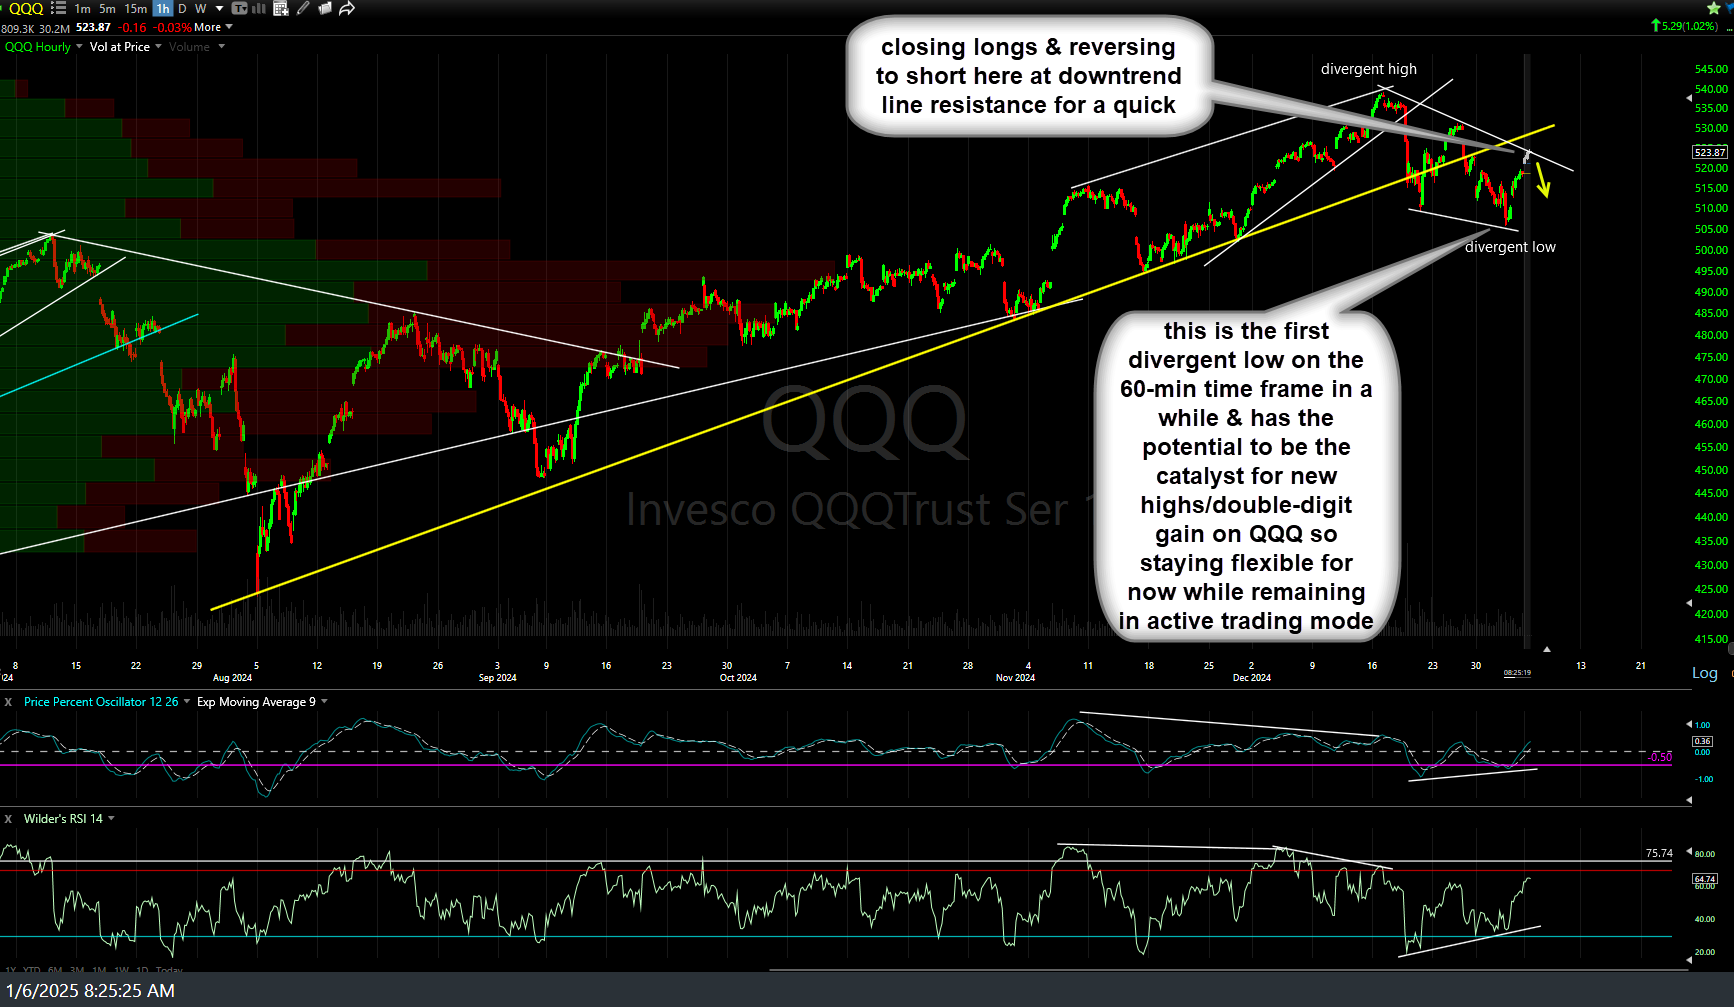
QQQ 60m Jan 6th