
Shortly after the last update highlighting the break of the key 16964 support (and 3rd sell signal/objective short entry of the day) in the final half-hour of trading yesterday, I followed up with the 60-minute chart of QQQ in the comment section below, highlighting that QQQ had just hit my first target (downtrend line) where, despite my previous post where a bounce was my alternative scenario, that on further review of the charts (because QQQ just hit T1), a reaction was likely.
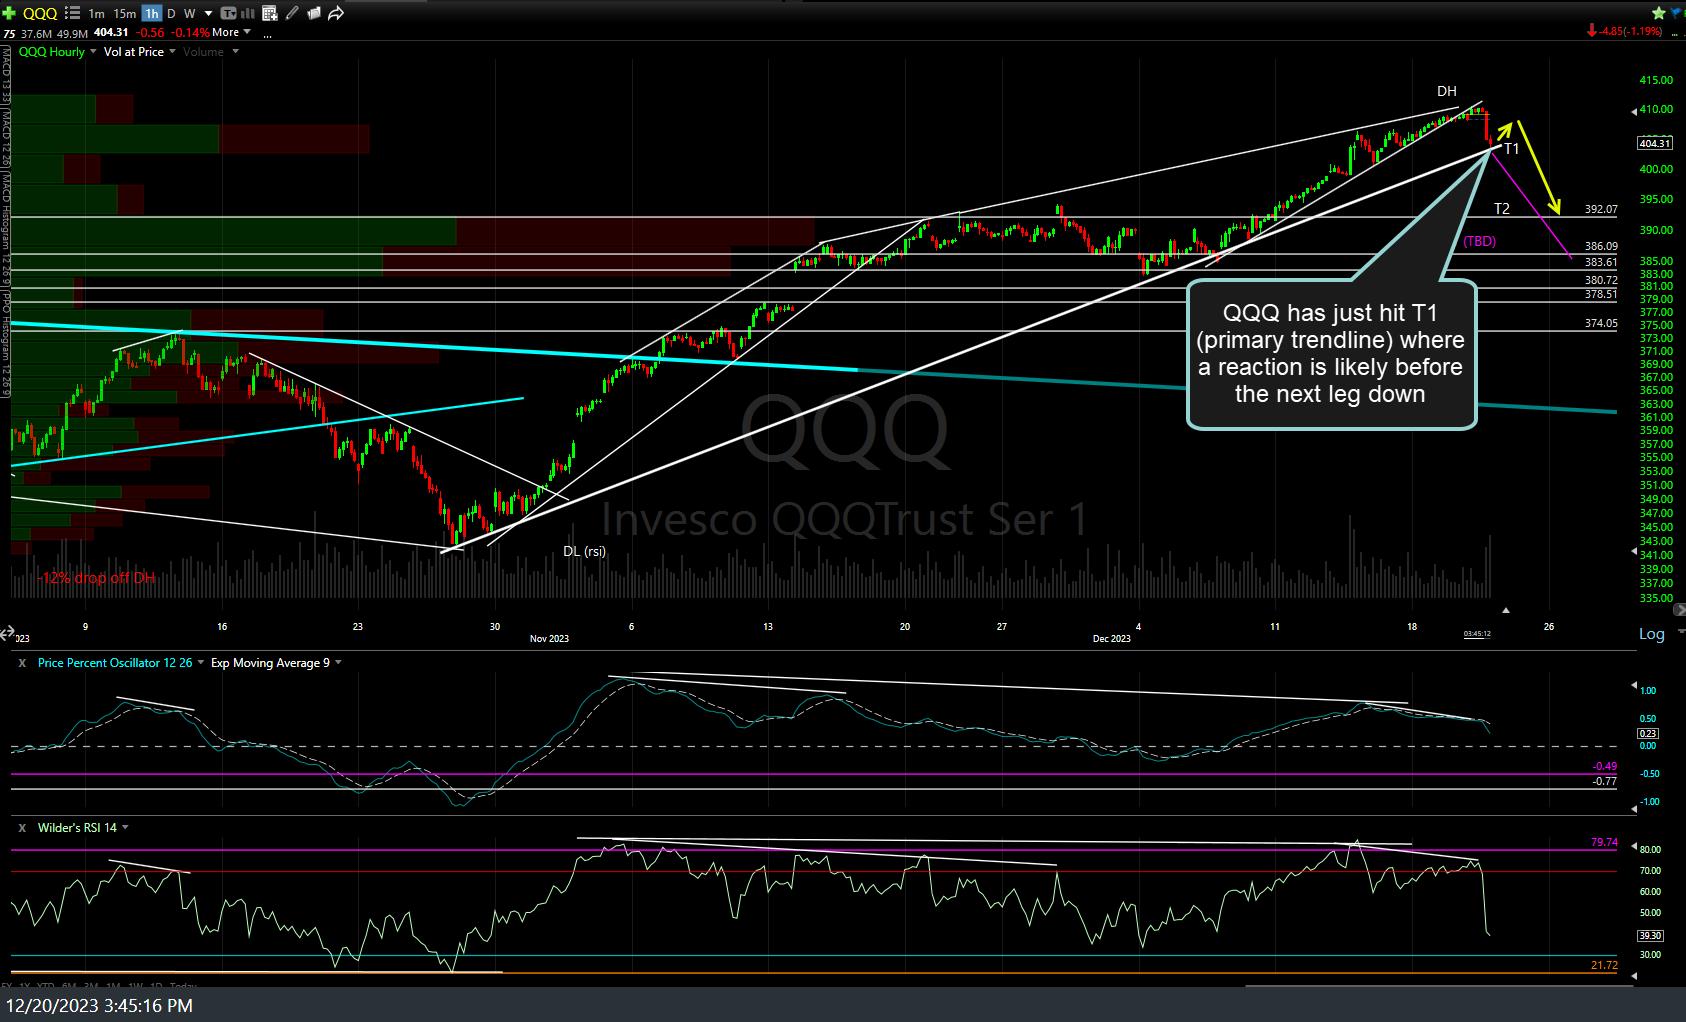
QQQ-60m-Dec-20th
Both QQQ & /NQ did bounce from there (hence, the /NQ alternative/bounce scenario became my primary scenario) with /NQ & QQQ just hitting those bounce targets, thereby offering an objective level to add back any shorts and/or close any “active trader” longs taken for a bounce trade. A tight stop could be placed just above or below yesterday’s highs or those targeting a much larger drop could give the trade some more room. Previous (yesterday’s) and updated /NQ & QQQ 60-minute charts, below.
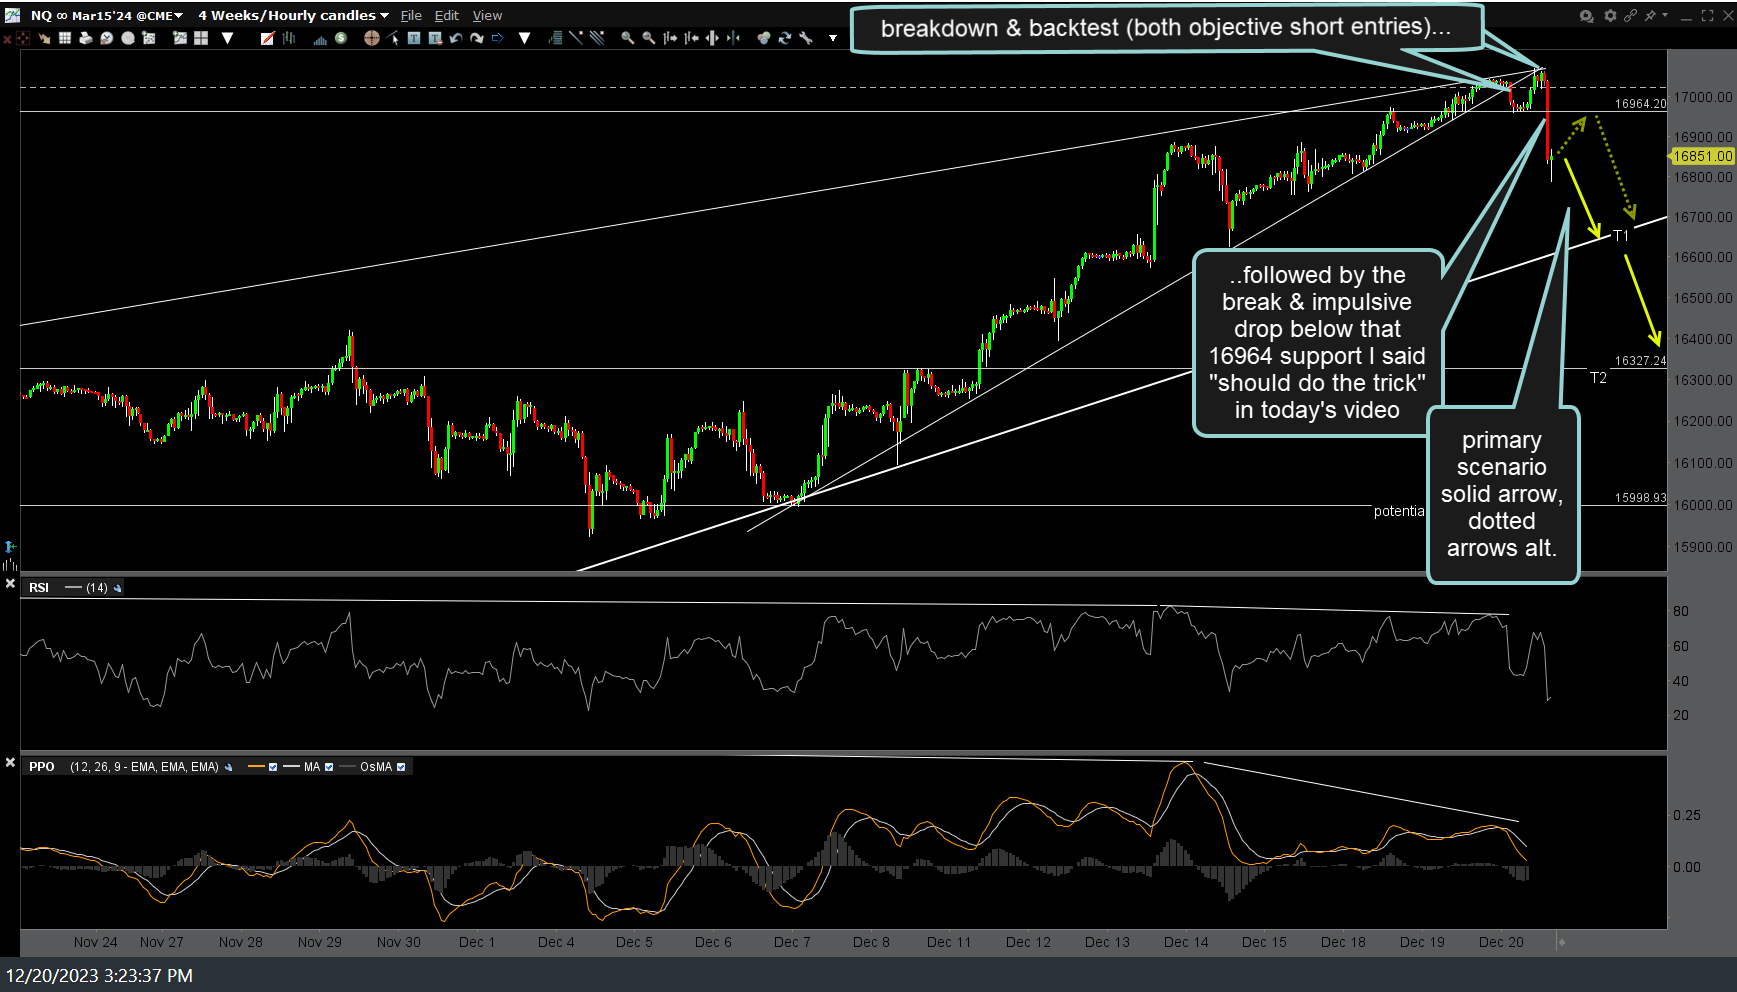
NQ 60m Dec 20th
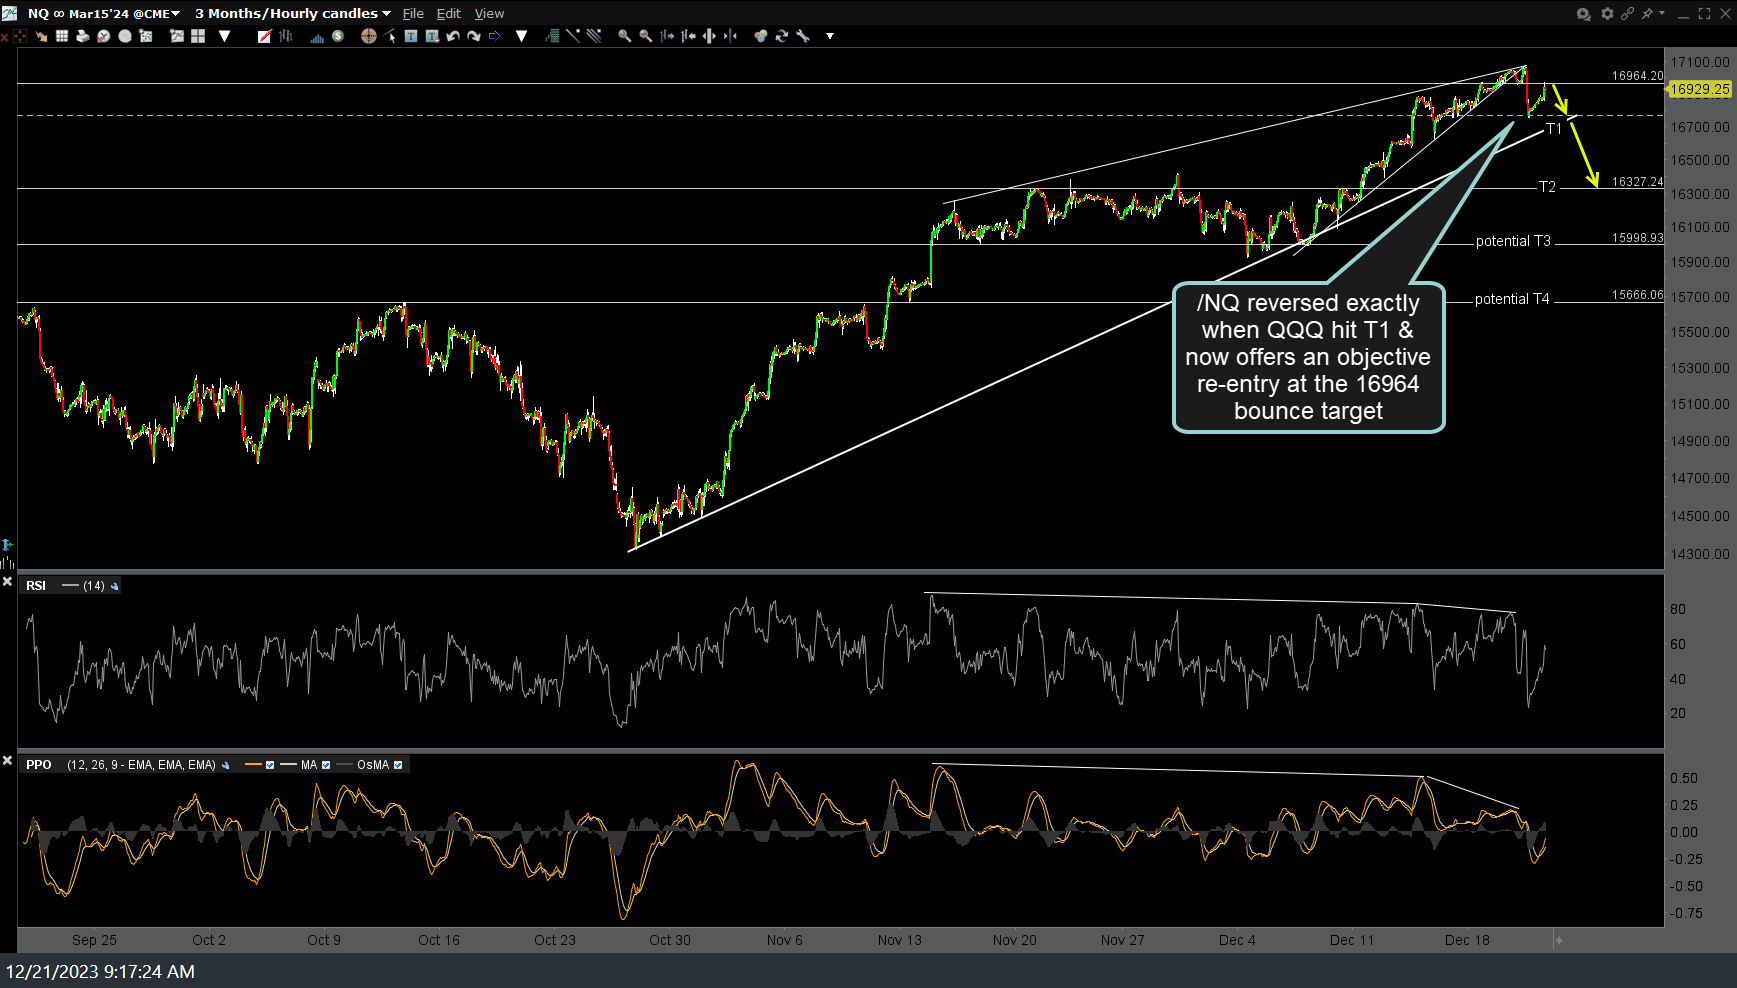
NQ 60m Dec 21st
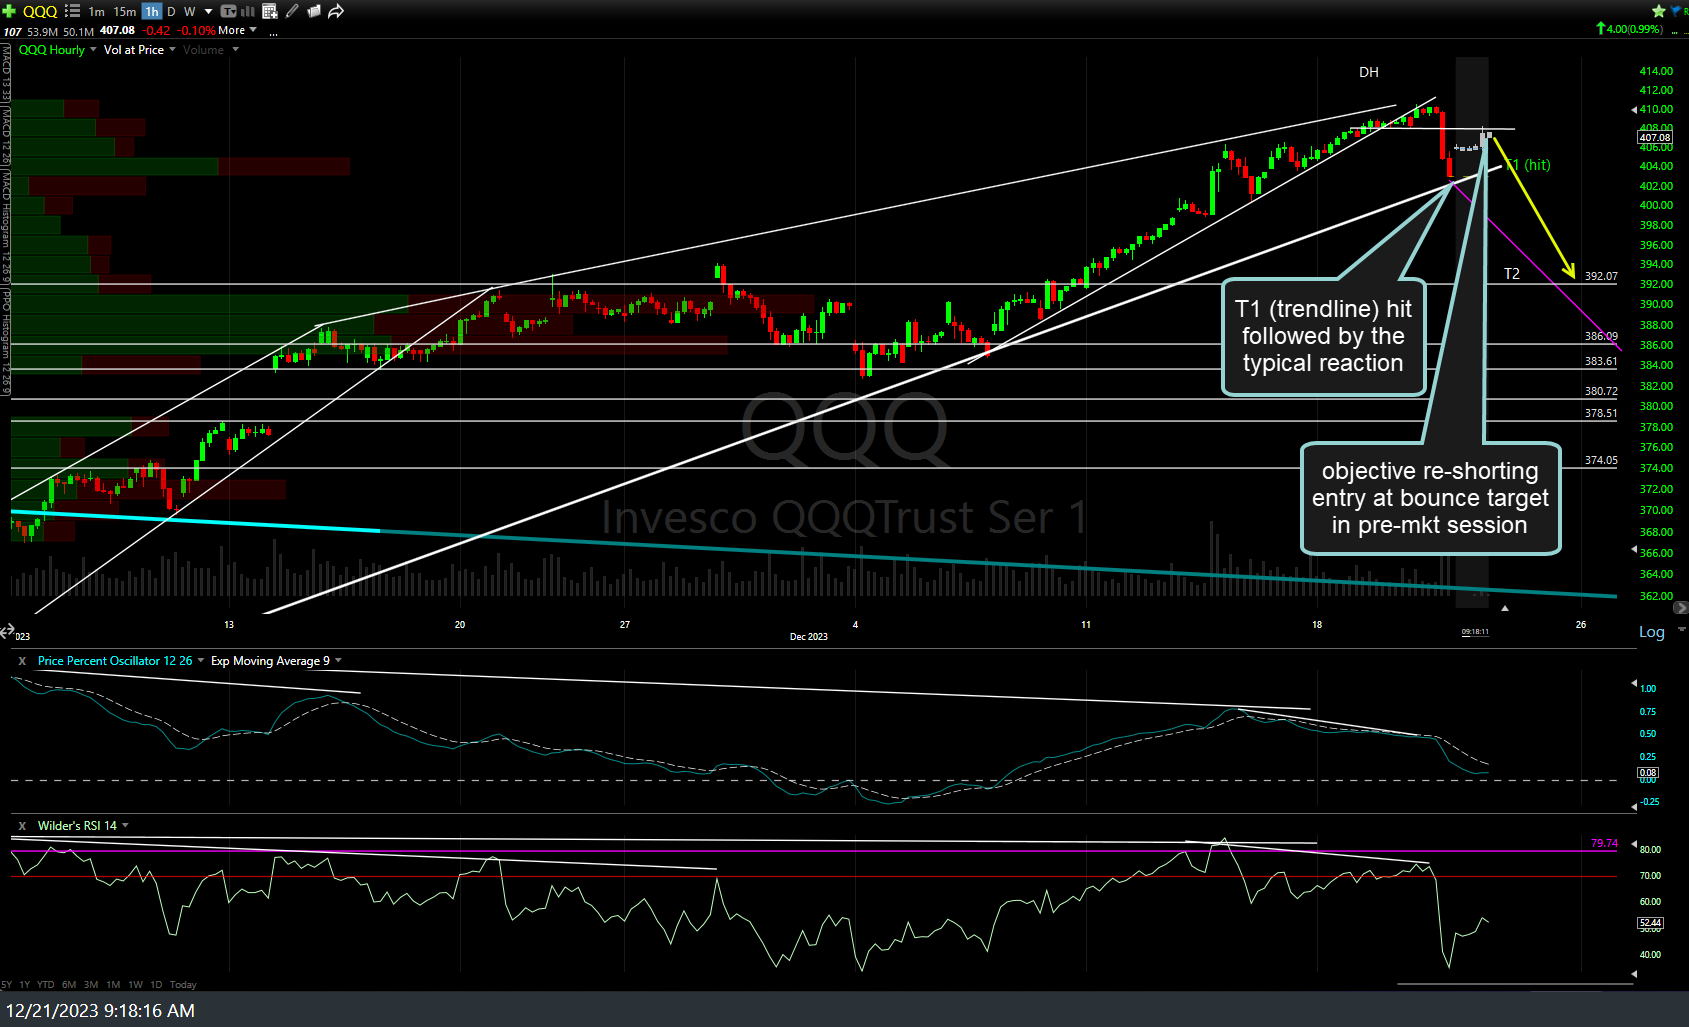
QQQ 60m Dec 21st