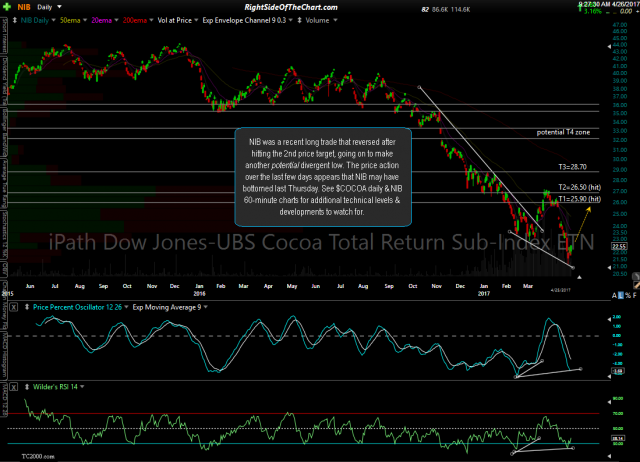
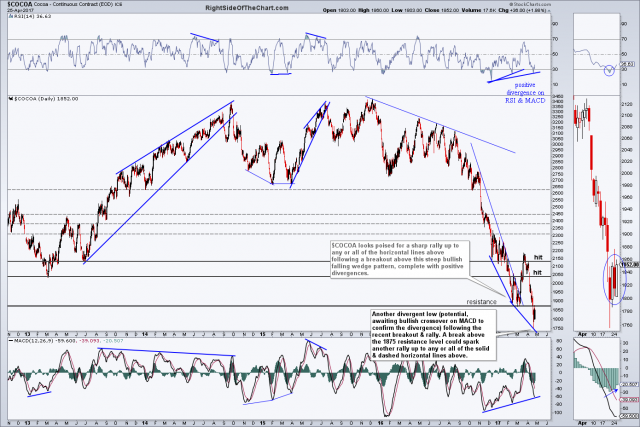
NIB (Cocoa ETN) was a recent long trade that reversed after hitting the 2nd price target, going on to make another potential divergent low. The price action over the last few days appears that NIB may have bottomed last Thursday. See $COCOA daily & NIB 60-minute charts for additional technical levels & developments to watch for. NIB & $COCOA daily charts below:
- NIB daily March 25th close
- $COCOA daily March 25th close
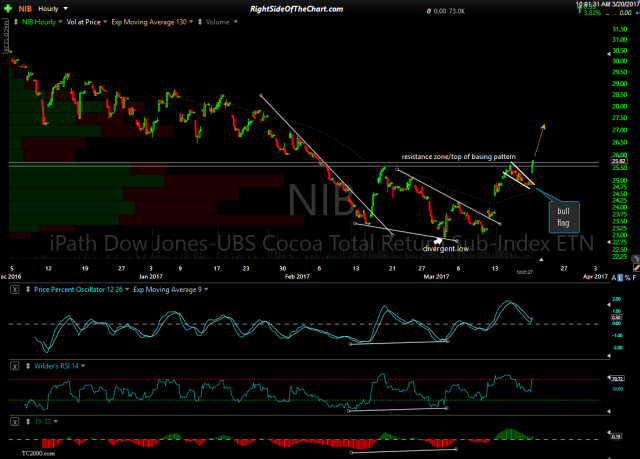
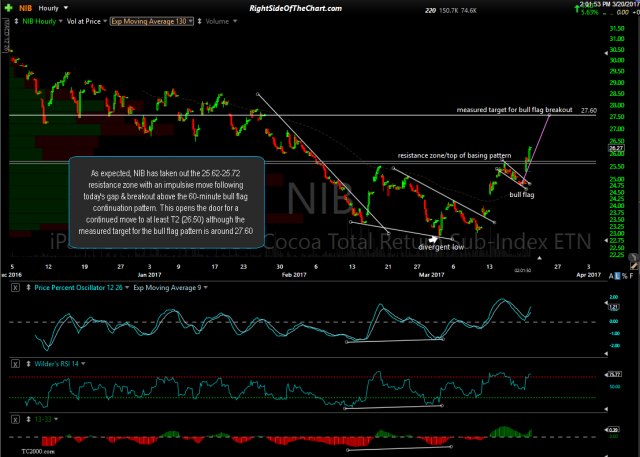
This 60-minute chart of NIB shows how the previous rally unfolded & some key levels to watch, particularly the 23.10ish resistance level as well as the trend indicators below crossing to bullish, for the next potential buy signal. The previously posted & updated 60-minute charts of NIB shown below:
- NIB 60-minute March 20th
- NIB 60-min 2 March 20th
- NIB 60-min March 25th close
As mentioned in the last update when the previous NIB trade exceeded the suggested stop, NIB is still on watch for another potential long swing trade with the specific entry criteria, price targets, etc.. to be determined if/when this become an official trade idea.


