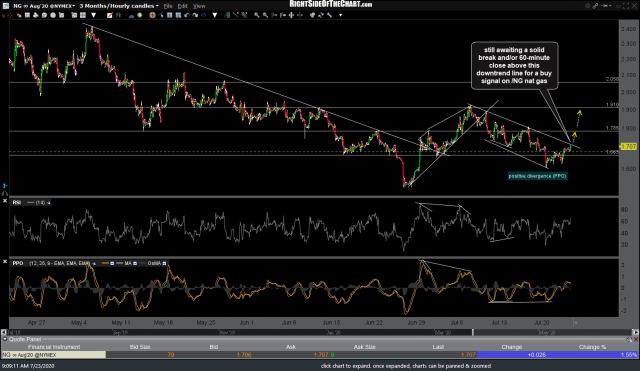
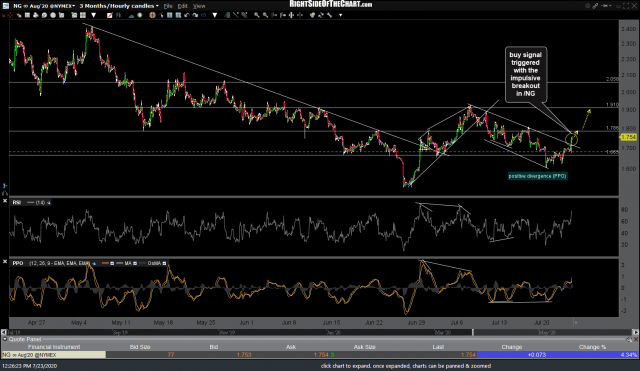
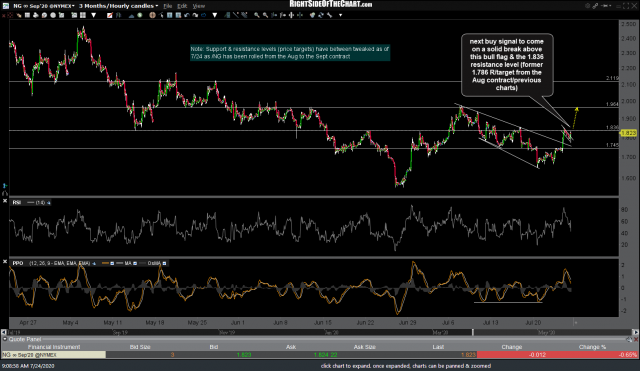
The next buy signal on /NG (natural gas futures) to come on a solid break above this bull flag & the 1.836 resistance level (former 1.786 resistance/target from the Aug contract/previous charts). The charting platform used for these 60-minute futures charts will periodically roll to the next expiration on the continuous contract. The previous charts that I posted on /NG in recent weeks, included the two charts posted yesterday, were the August continuous contract which my platform has now rolled to the September continuous contract. As such, the price values of the support & resistance levels have changed slightly as the contract month has changed. Previous (Aug) 60-minute chart, from yesterday, and the updated (Sept) 60-minute charts below. Note: Multiple charts in a gallery format as below will not appear on email notifications but may be viewed on rsotc.com (short url)
- NG 60m July 23rd
- NG 60m 2 July 23rd.png
- NG 60m July 24th
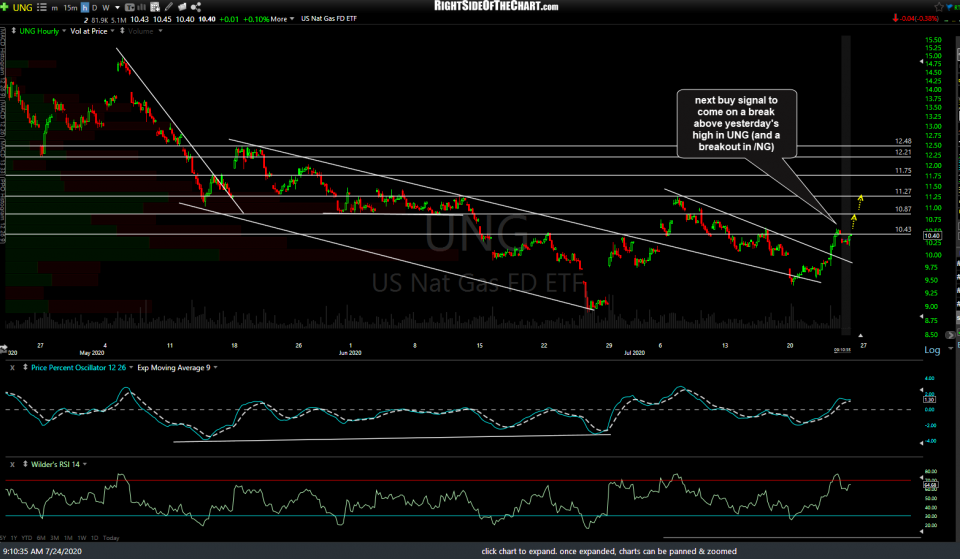
Likewise, the next buy signal on UNG (nat gas ETN) to come on a break above yesterday’s high in UNG (and a breakout in /NG). In addition to UNG, another proxy for trading natural gas is /QG, the NYMEX MINY Natural Gas Index futures contract, which trades at the same price level (and hence, the same charts) as /NG but with a smaller multiplier (leverage factor).


