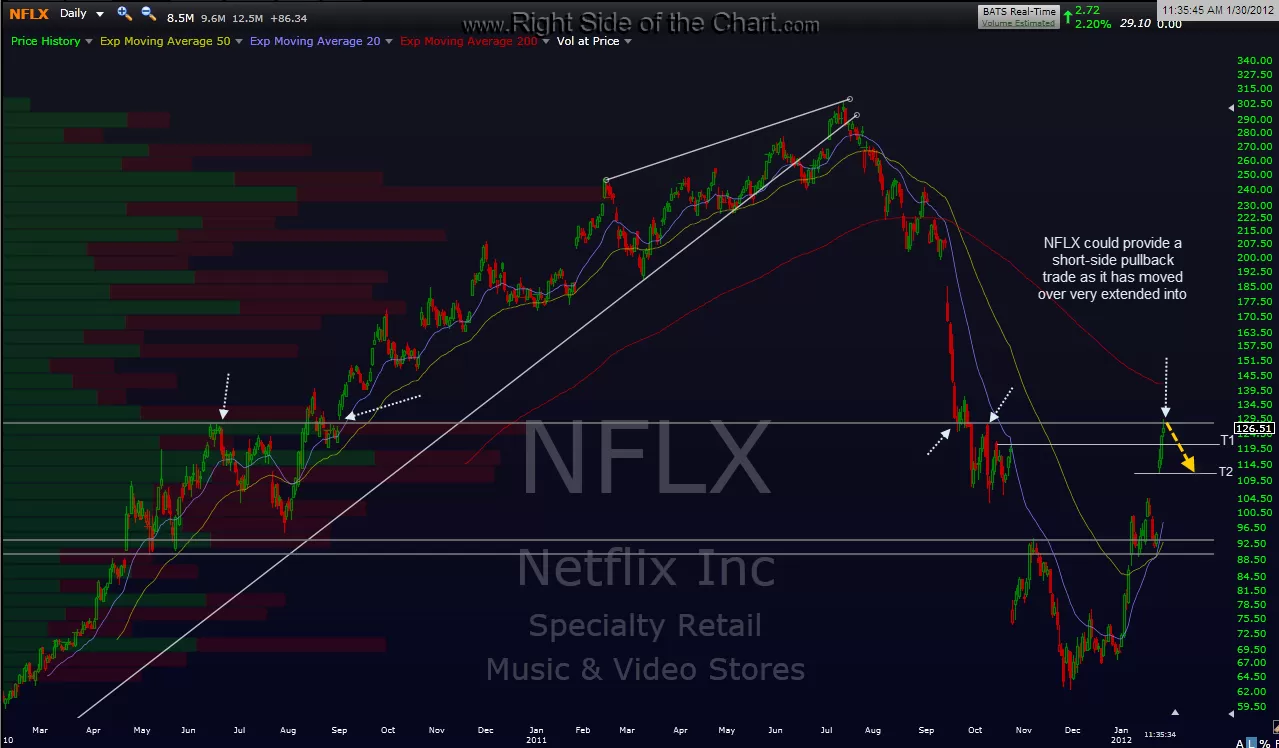
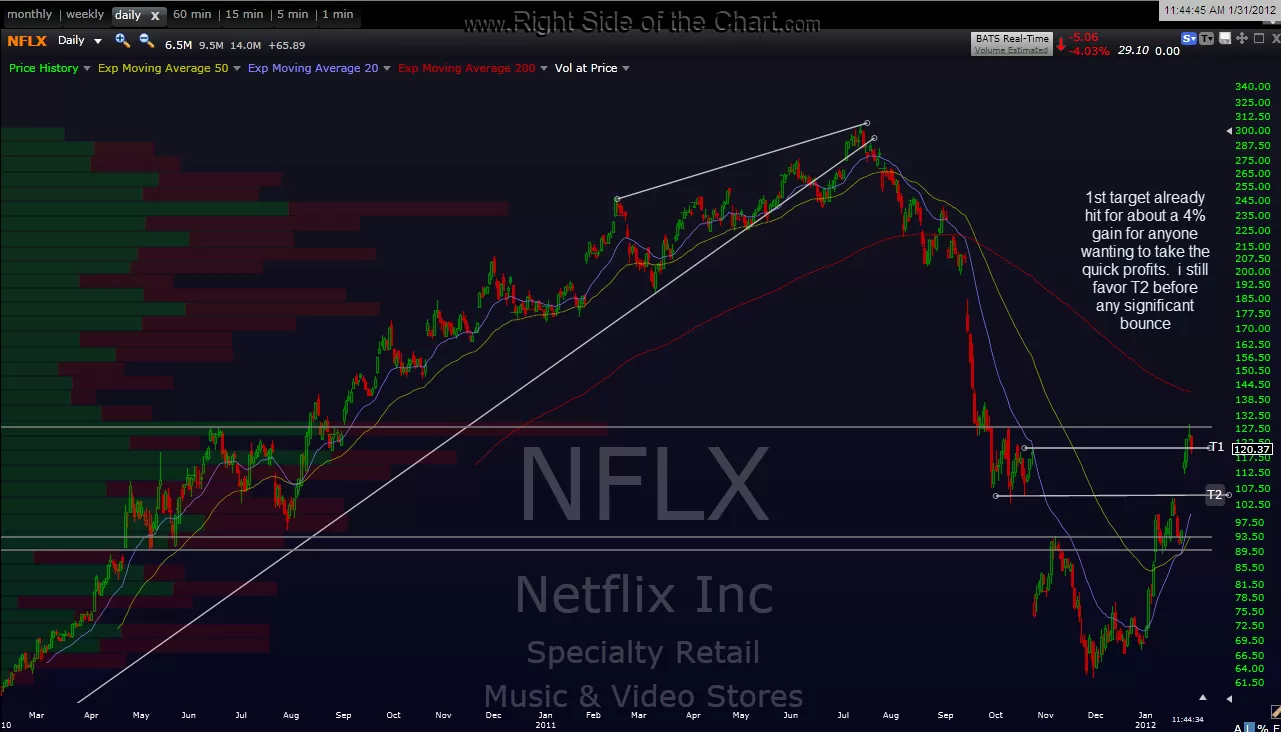
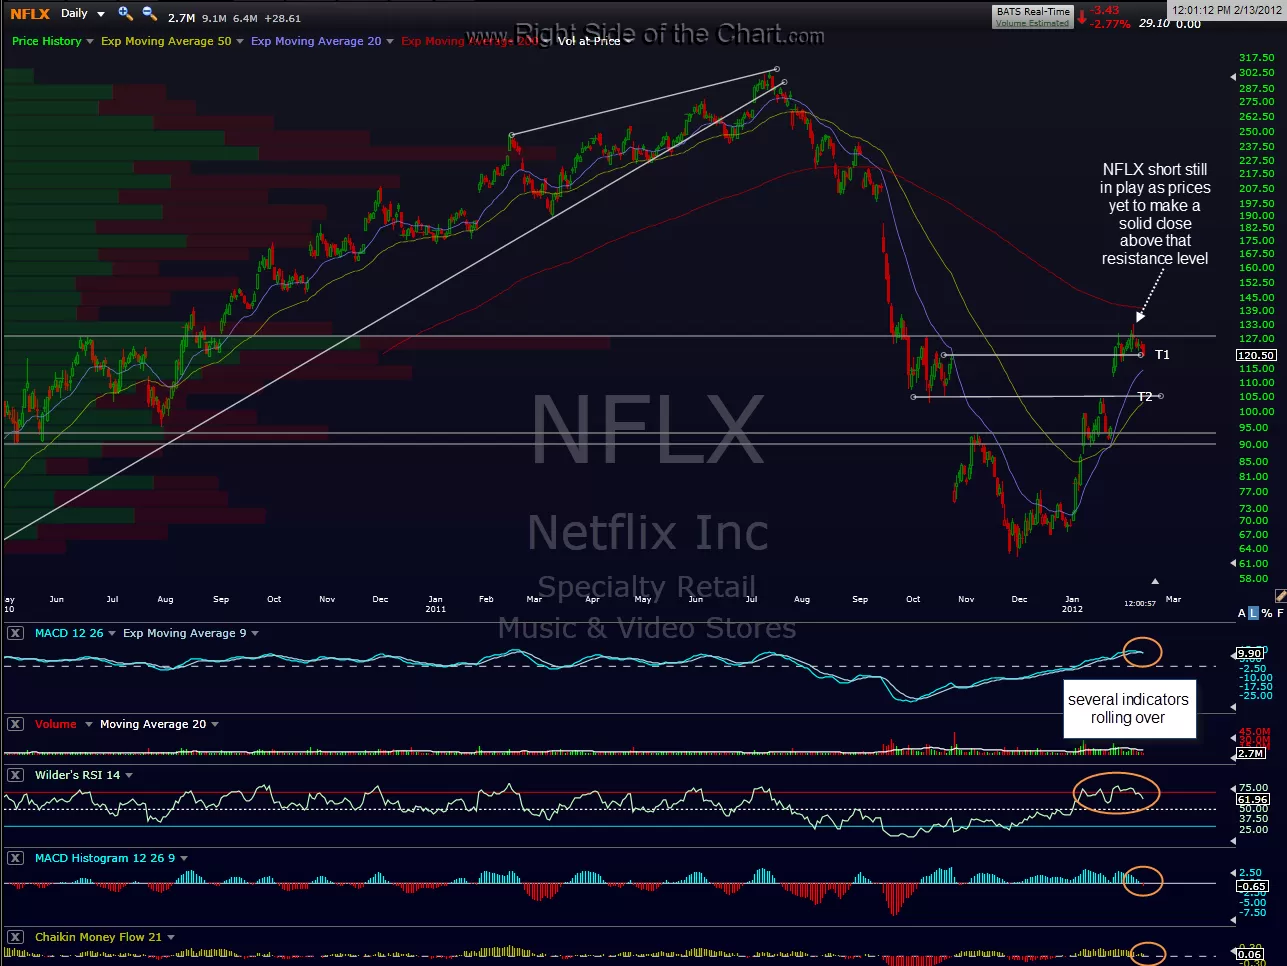
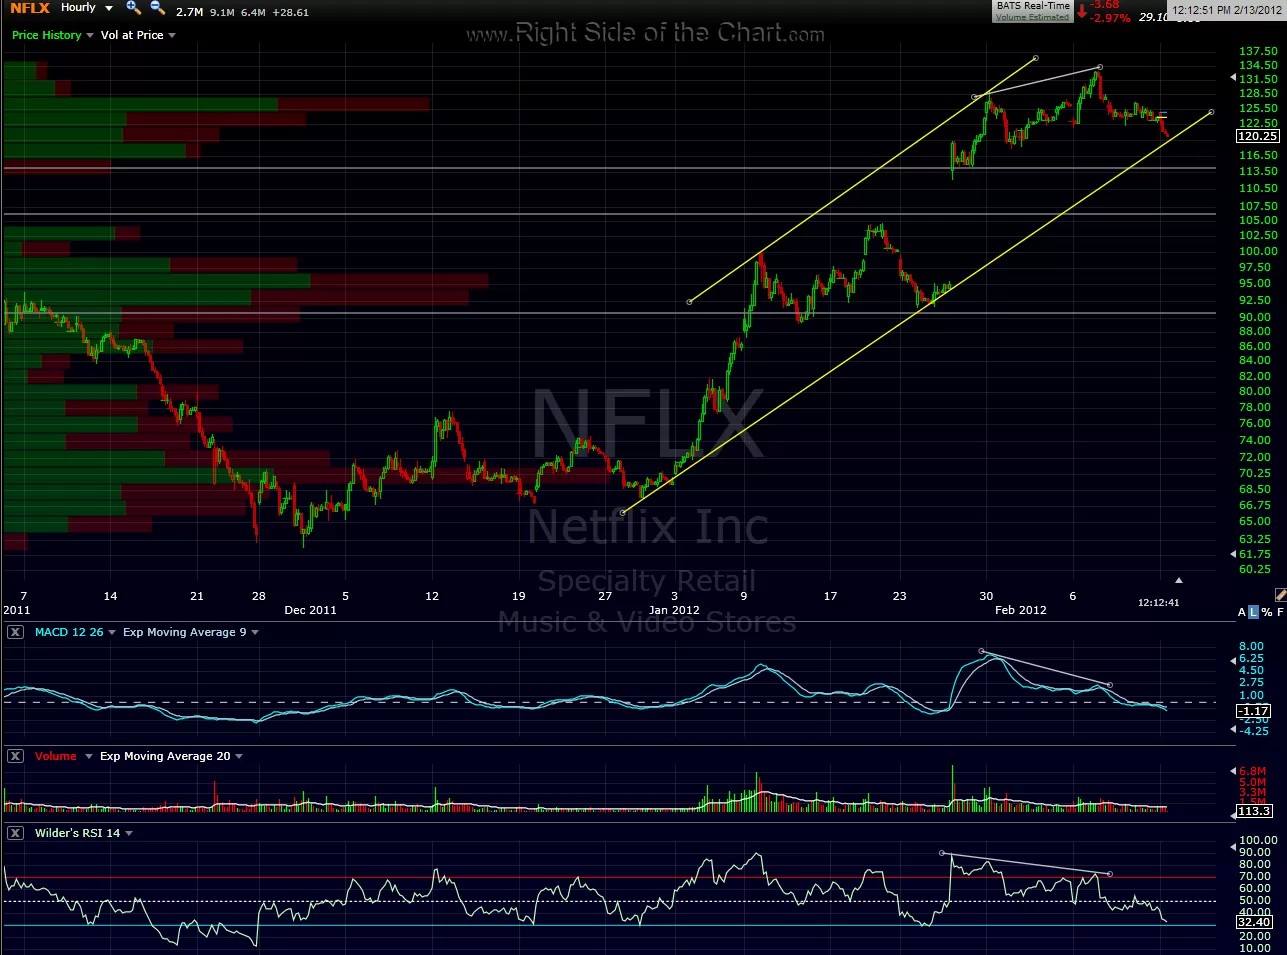
the last post on the recent NFLX short trade showed that T1 was hit and traders might cover and take the quick profits. anyone that held out looking for T2 will note that after getting the expected bounce off of the T1 support area, prices went back to the entry point (resistance) and have so far failed to make a solid close above that level (only an intraday spike which quickly fell back below that level). if NFLX closes below the T1 support area, odds look good that at least T2 will be hit soon (another 12% gain), especially considering that many indicators are the daily time frame are rolling over. the first 3 charts are the daily charts, in order as posted, including today’s. the last chart is a 60 min chart showing a uptrend channel with negative divergences in place on the last thrust higher. a breakdown of that channel would coincide nicely with a break of that daily support line, providing an objective short entry with the appropriate stops in place.

Results for {phrase} ({results_count} of {results_count_total})
Displaying {results_count} results of {results_count_total}