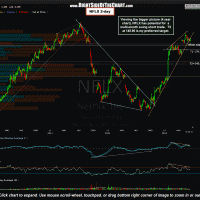
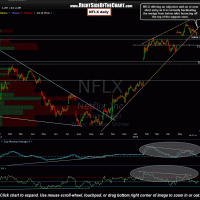
NFLX recently triggered a short entry on the break below this very steep & over-extended uptrend line. From there, the stock bounce exactly off the top of the previously highlighted support zone and is up sharply today as it makes a perfect backtest of the pattern from below, thereby offering an objective add-on or new short entry. The updated daily chart is below along with a 2-day period chart spanning 4 years which shows how breakouts (and the subsequent backtest in each instance) of these primary uptrend and downtrend lines were the beginning of new trend changes in the stock and provided very lucrative long or short entries. As NFLX is a volatile stock and as the price swings around these key inflection points are often substantial, my preference is to use a scale-in strategy. For example, shorting a 1/4-1/2 position on the original trendline break, shorting another 1/4 – 1/2 position on this backtest, then bringing the trade to a full position once prices break below that minor support level.
Results for {phrase} ({results_count} of {results_count_total})
Displaying {results_count} results of {results_count_total}


