
/NG natural gas futures have impulsively broken out above the 2.388 resistance level & appears to be headed to the 2.50 level, whether or not it backtests the 2.40ish level first (providing an objective entry, if so) or not. 60-minute chart below.

NG 60-min July 5th
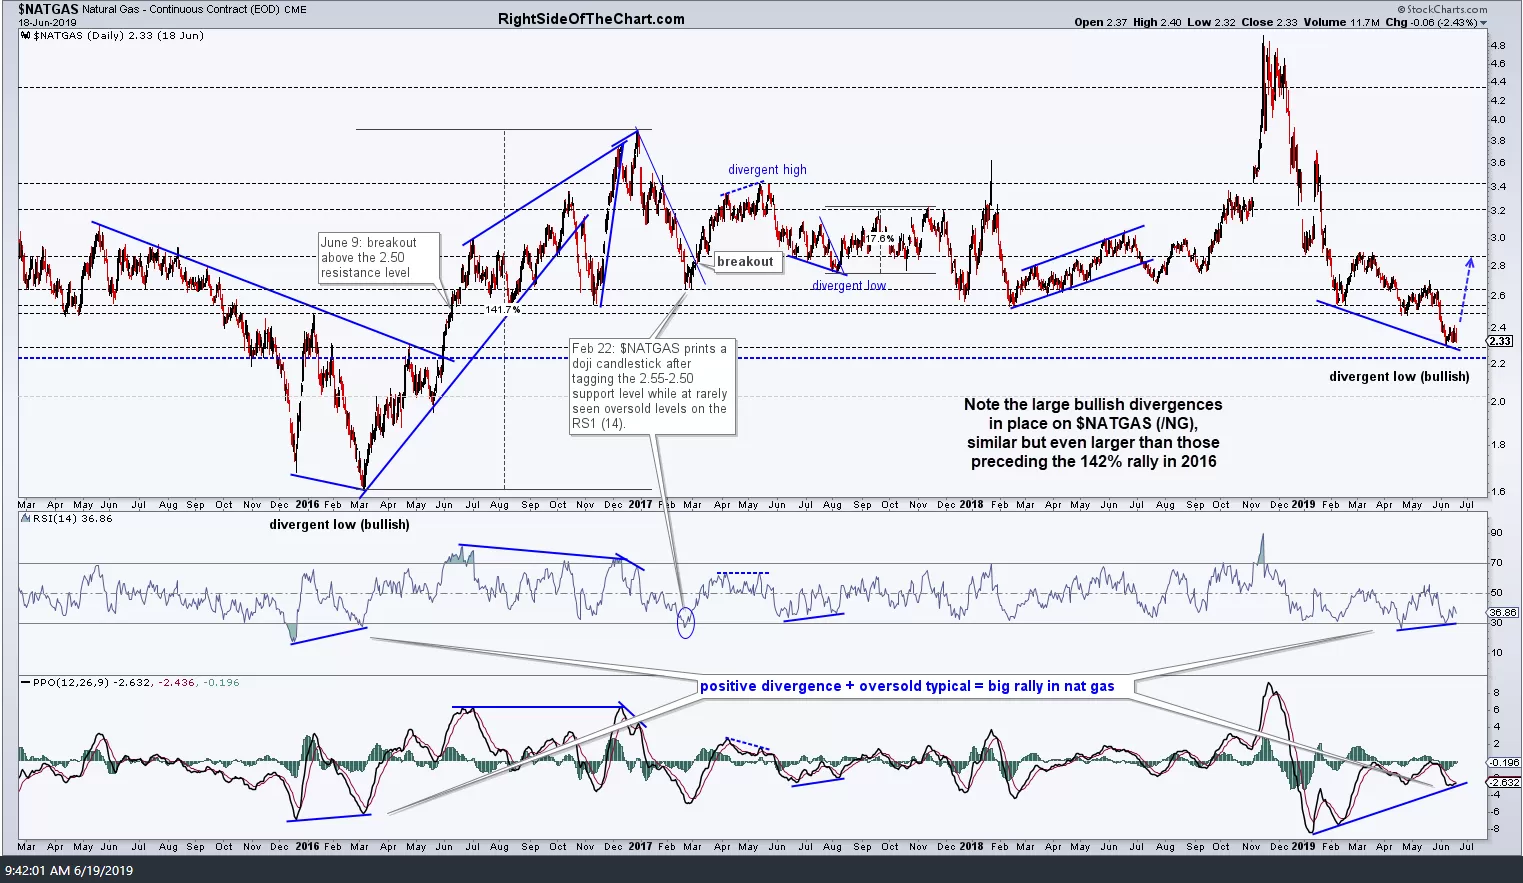
The bullish divergences on the daily chart $NATGAS (nat gas futures) that were posted back on June 19th (first chart below) are still intact, as nat gas prices have mostly held steady since then although today’s breakout on the 60-minute chart could be the catalyst for a sustained rally. (note: today’s gains are not yet reflected on the updated daily chart below, as that stockcharts.com chart only updates at the end of each day)
-
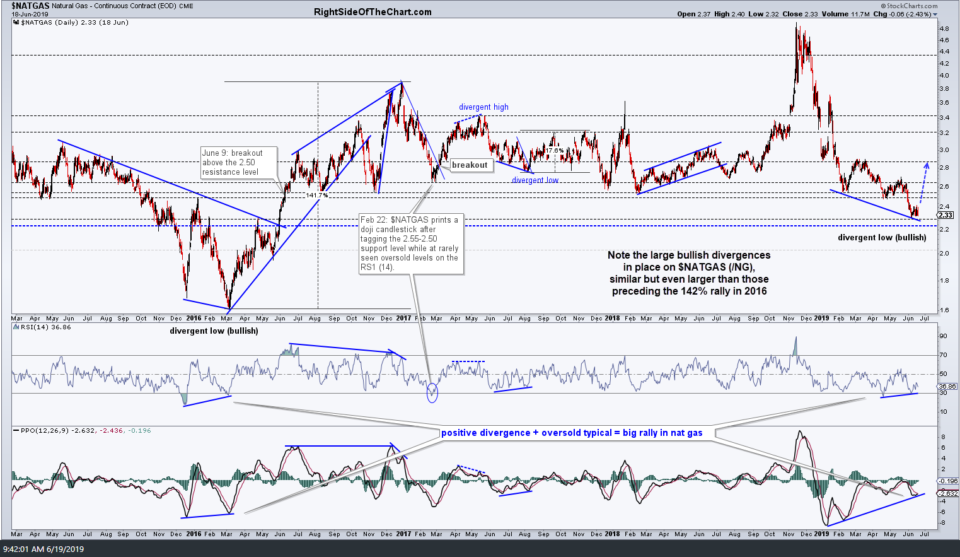
- $NATGAS daily June 19th
-
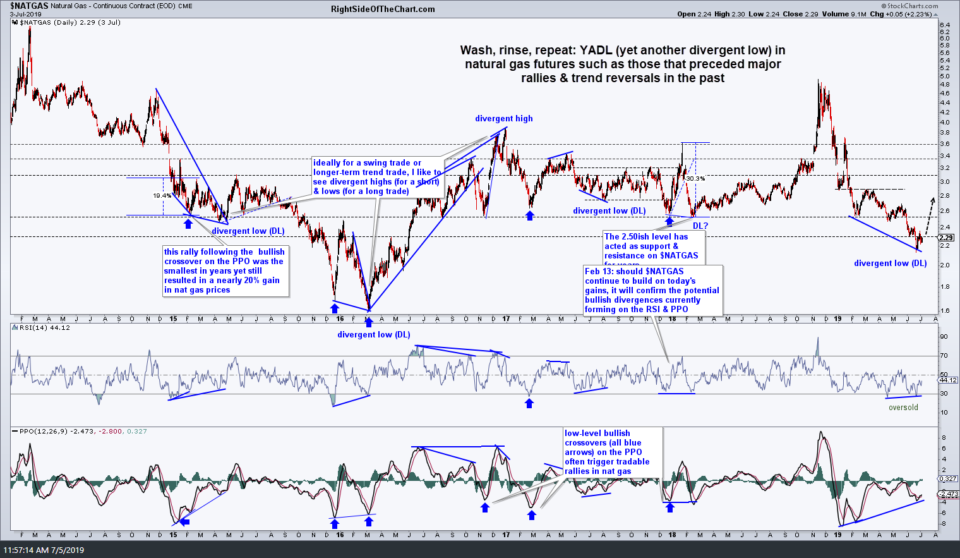
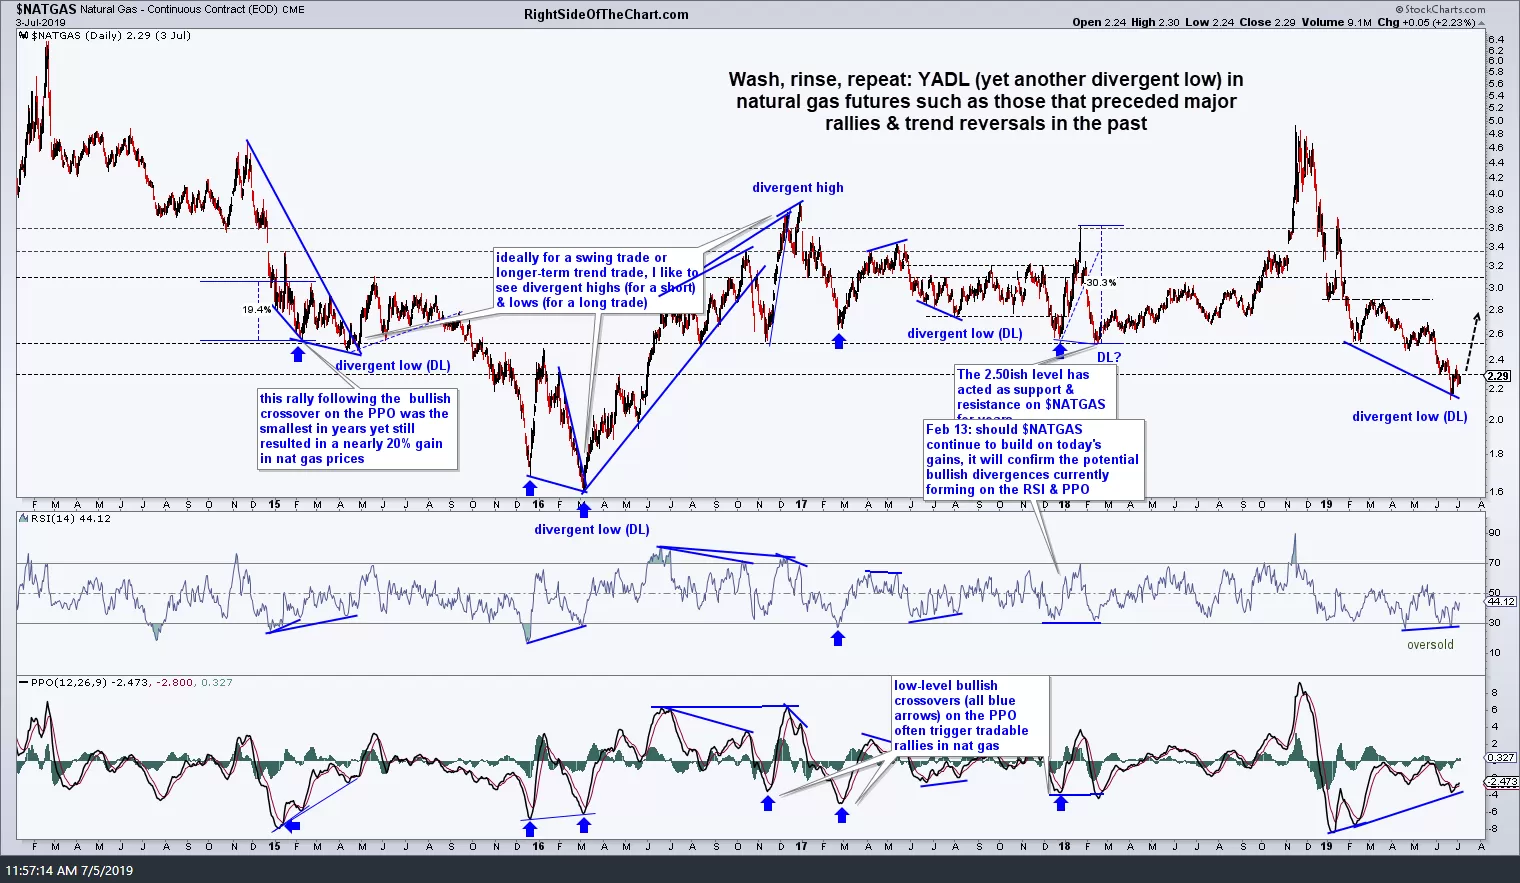
- $NATGAS daily July 5th
There are several proxies for trading natural gas, which I’m only passing along as unofficial trade ideas for now. /NG is the Henry Hub nat gas futures contract with /QG being the NYMEX Natural Gas Index futures contract which has a multiplier of 2,500 (vs. the 10,000 multiplier of /NG), allowing one to trade futures with 1/4th the leverage of the standard /NG contract.
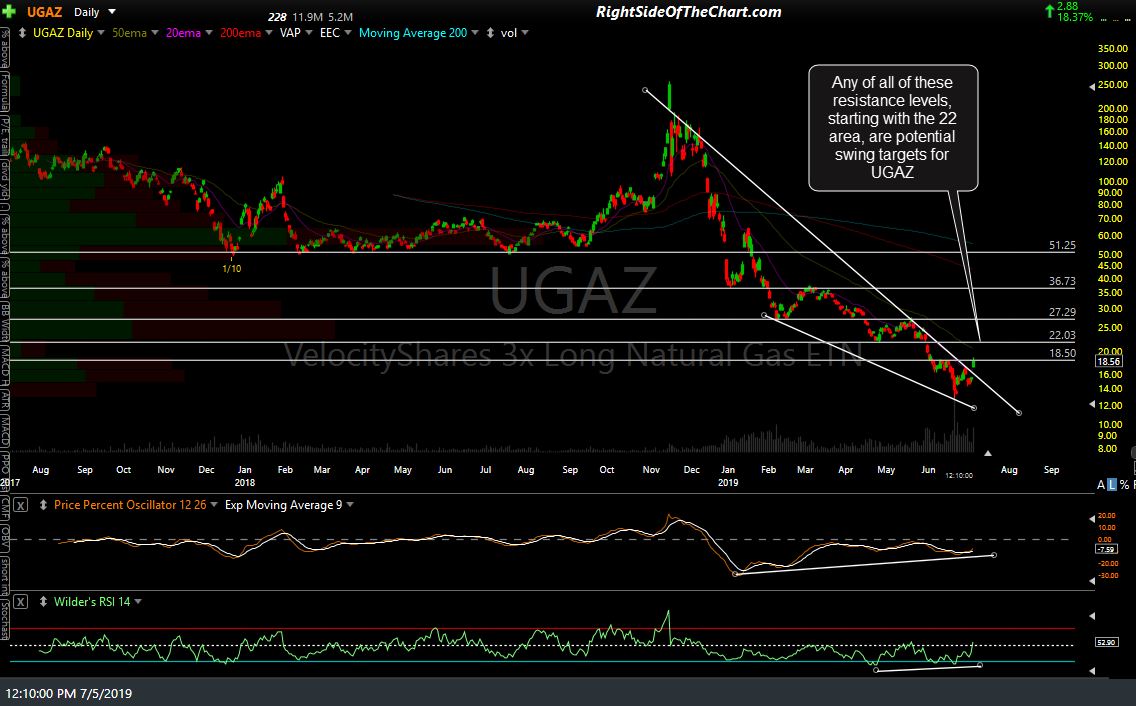
UGAZ daily July 5th
There are also several ETN that track nat gas by rolling futures contracts & I’ve listed some potential swing targets for UGAZ (3x long nat gas ETN) on the daily chart below. Just keep in mind that natural gas is about the most volatile commodity out there & daily price swings in the double digits are not uncommon. As such, make sure to account for both the leverage factor as well as the above-average volatility in regards to your position size when trading natural gas.