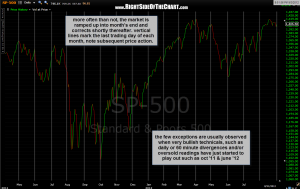
 for years, i have noticed how more often than not, the market is either held up or ramped up into month end, with prices usually either correcting immediately beginning on the first trading day of the next month or just a few trading sessions after. i only went back about 17 months on this chart although the pattern has been something that i’ve noticed for years. like most patterns in technical analysis, it is not 100% reliable but i will say that from my observations, the few times that prices did not correct at or shortly after the beginning of the month were either when the market was in a very powerful uptrend, such as the early stages of a new bull market, or when the technicals are very bullish, such as they were back in october 2011 as the market was bottoming after a very strong correction while very oversold & with strong positive divergences in place on the daily frames. the pattern also failed play out heading into the june 4th, 2012 lows when my downside price targets were hit while the markets were oversold with bullish divergences in place across the 60 minute charts. translation: don’t trade this pattern in a vacuum, rather use the techincals to confirm or refute the pattern before closing your longs or shorting the market at month end.
note the price action following the the vertical lines on this SPX daily chart, which mark the last trading day of each month. as pointed out recently, we have bearish technicals all the way out from the weekly charts down to the 60 minute time frames, thereby sharply increasing the odds that this pattern plays out in september (the stock market begins at least a moderate correction within a week).

