Consumer spending & the retail sector is a key component of the US economy so with all the recent buzz about Black Friday, Cyber Monday & all the other over-hyped reasons that the retail industry has convinced consumers to whip out their credit cards following the Thanksgiving holiday in recent years, I figured that the retail stocks are worth keeping an eye on in the coming weeks.
I don’t pretend to have all the answers or have this whole stock market thing figured out but if I can pass along one thing that I’ve learned over the years when it comes to investing it would be to take what you read & hear from the mainstream media with a big grain of salt & pay more attention to what stock prices are telling you than the headlines in the papers or what some so-called expert on TV is spewing out as to why you should buy this or that stock or sector. That might sound a bit cynical but my point is that the charts speak much louder than words.
The latest headlines are that Black Friday sales broke all previous records & that retailers are forecasting a record 4-day sales period culminating with today’s Cyber Monday. I don’t doubt that will be the case once today’s final sales figures are tallied but as most are aware, the stock market & price discovery can be a fairly complex process that often seems in direct contrast with what might appear to be a clearly bullish or bearish fundamental backdrop at the time. Those disconnects between what a stock, sector or the broad market should be doing (based on the fundamentals) and what it is actually doing (moving higher or lower) can be the result of many factors, including but hardly limited to a “buy the rumor, sell the news” event (XRT rallied a very impressive 15.4% in just 11 trading sessions leading into Friday’s highs).
While one day does not make a trend, I have noticed that the retail sector (via XRT) is coming under some moderate selling pressure on above average volume today. This could prove to simply be a healthy bout of profit taking after an extended, overbought rally, with XRT eventually going on to blast off to new highs in the coming weeks or month or it could possibly mark the end of a counter-trend rally in the early stages of a new bear market that kicked off in the retail sector back in early April of 2015 when XRT printed an all-time high that has yet to be revisited since, despite most (but not all) of the major U.S. stock indices recently eking out marginal new highs.
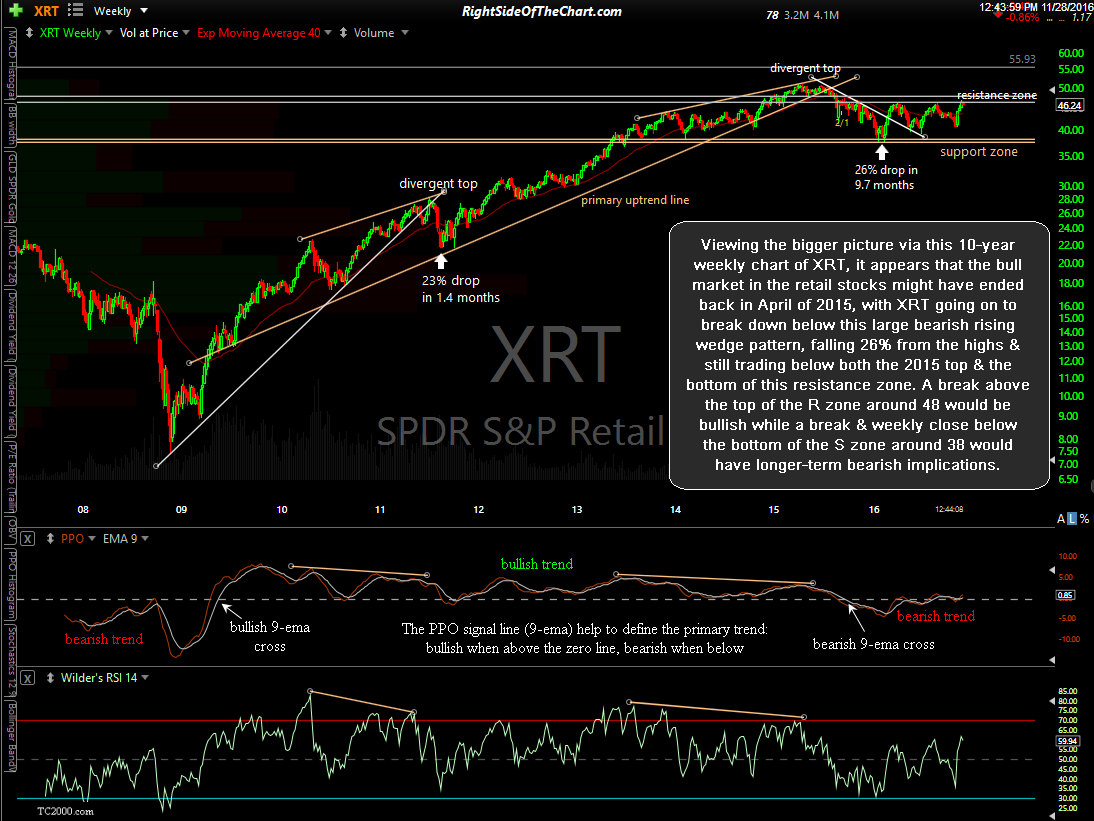
Viewing the bigger picture via this 10-year weekly chart of XRT (Retail Sector ETF), it appears that the bull market in the retail stocks might have ended back in April of 2015, with XRT going on to break down below this large bearish rising wedge pattern, falling 26% from the highs & still trading below both the 2015 top & the bottom of this resistance zone. A break above the top of the resistance zone around 48 would be bullish while a break & weekly close below the bottom of the support zone around 38 would have longer-term bearish implications.
Zooming down to this 2-year daily chart, it appears that last week’s breakout above the March 20th & Aug 23rd reaction highs in XRT has failed, with XRT trading down nearly 1% so far today, now back below both of those previous reaction highs. Adding to the bearish case is the fact that should XRT continue to move lower in the coming days (a big IF but certainly something to watch for), that would help to confirm that last week’s breakout was indeed a bull trap/false breakout. As I often say, fewer technical events in trading are more bearish than a failed breakout.
One other thing worth noting is the potential negative divergences forming on the daily time frame. Should XRT continue to move lower following today’s sell-off & move back down below the March & August reaction highs, not only will that help to solidify the failed breakout (bearish) but it will also confirm the potential negative divergences that have been building on the MACD & RSI since earlier this year, adding to the bearish case for the retail sector.


