I’ll spend some time this evening and tomorrow morning looking thru the charts for anything that I might have missed on the index charts as well as looking for any new trade ideas that stand out. However, I don’t plan to do much until I see how those index bear-flags & pennants that I posted on Friday play out this week. Those flags may not end up breaking to the downside and if not, then I’ll be closely watching the resistance levels that are just overhead.
The longer-term charts still seem to point to more downside over the next few weeks/months and my bias continues to remain to the downside at this time but on the other hand, quite a few of my final swing targets on some key stocks have been hit as well as the second target (T2) on my SPY 60-120 minute time frames and T3 on the QQQ 4 hour and daily frames. Just like my trade ideas, on a trade or index chart, with each target that is hit, the odds decrease for the next target being hit. Of course, if I list a final target that is because I believe that target has a good chance of being hit or I wouldn’t bother listing it. Again, this is just a rough, generalized example but the targets work something like this: If a pattern triggers (i.e.- a breakout), then T1 has about an 90% chance of being hit, T2 an 80% chance, T3 70%, and T4 60%. Again, that varies with every trade and remember that the markets are dynamic, not static. Therefore, my analysis and targets can and often will change depending on how the technical picture evolves from the time a trade idea triggers an entry or the market breaks out or down from a pattern or key support/resistance level.
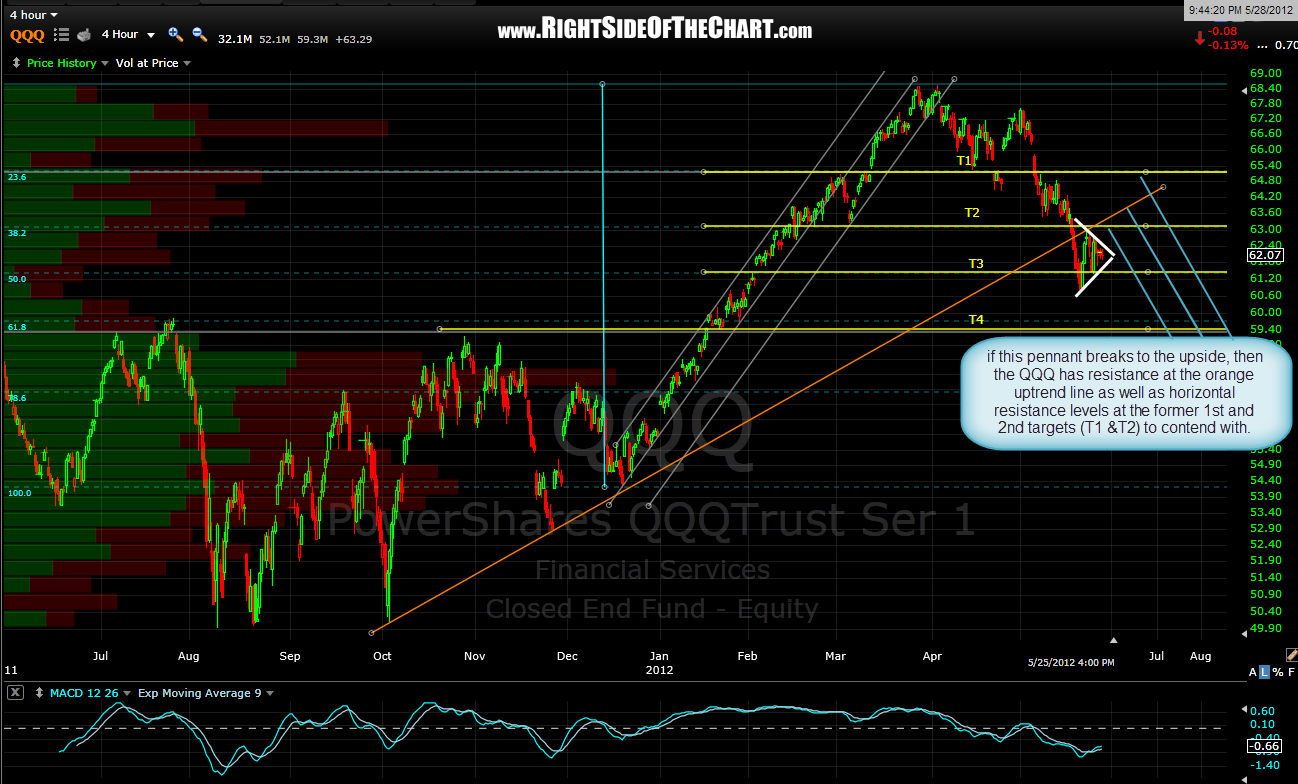
Another way to phrase my current thinking is that although I still favor additional downside in the near-term, my degree of confidence is not as high as it was several weeks ago when I posted as being 100% short (all-in). I will be watching those 60 min – 4 hour patterns closely this week and if they all break to the downside, then I will most likely add some more shorts. If they break to the upside, I will still want to see at least these initial resistance levels that are just overhead taken out before adding any more longs or removing any shorts, other than those that hit my pre-determined stops. 4 hour SPY & QQQ charts below.