
MJ (cannabis sector ETF) could snap back up to test the 23.15ish resistance & possibly the larger downtrend line should it break out impulsively above the current downtrend line as that would be a likely spark a short-covering/bear market/oversold rally. Daily chart below.
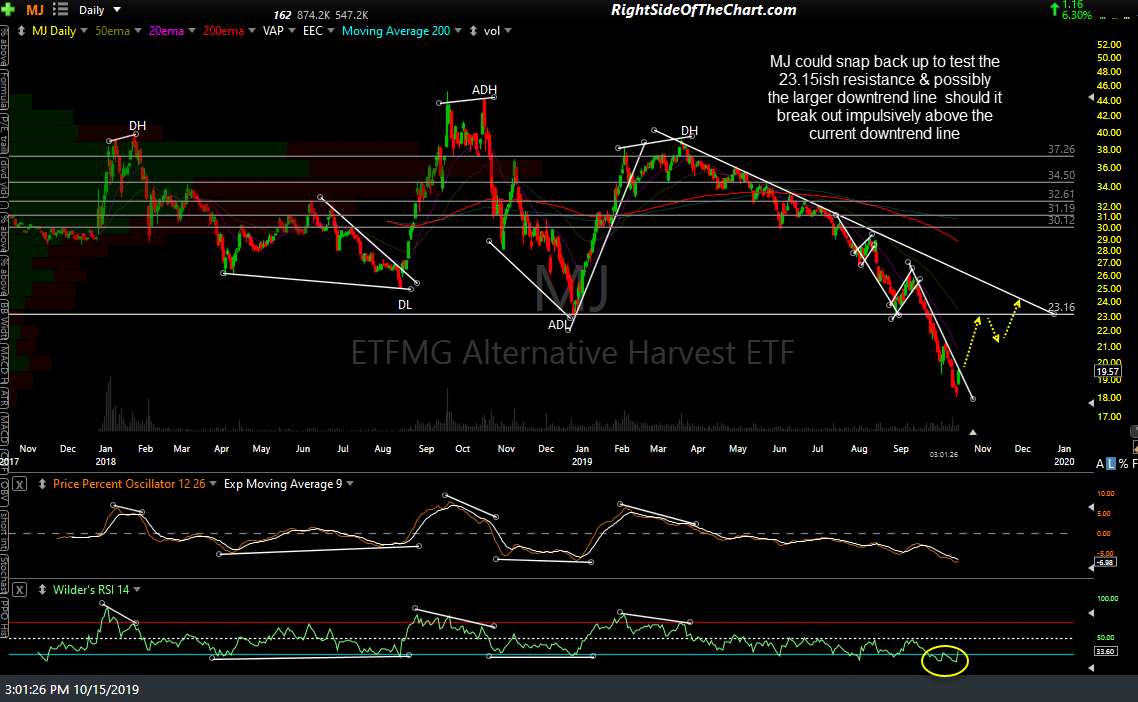
MJ daily Oct 15th
As there is still some work to be done to firm up the case for a tradable rally in the pot stocks, I’m only passing this along as a potential (untriggered) and unofficial trade setup for now. This 60-minute chart of MJ below lists some near-term (unadjusted) price targets with the next buy signal to come on an impulsive break above the 19.86ish resistance level.
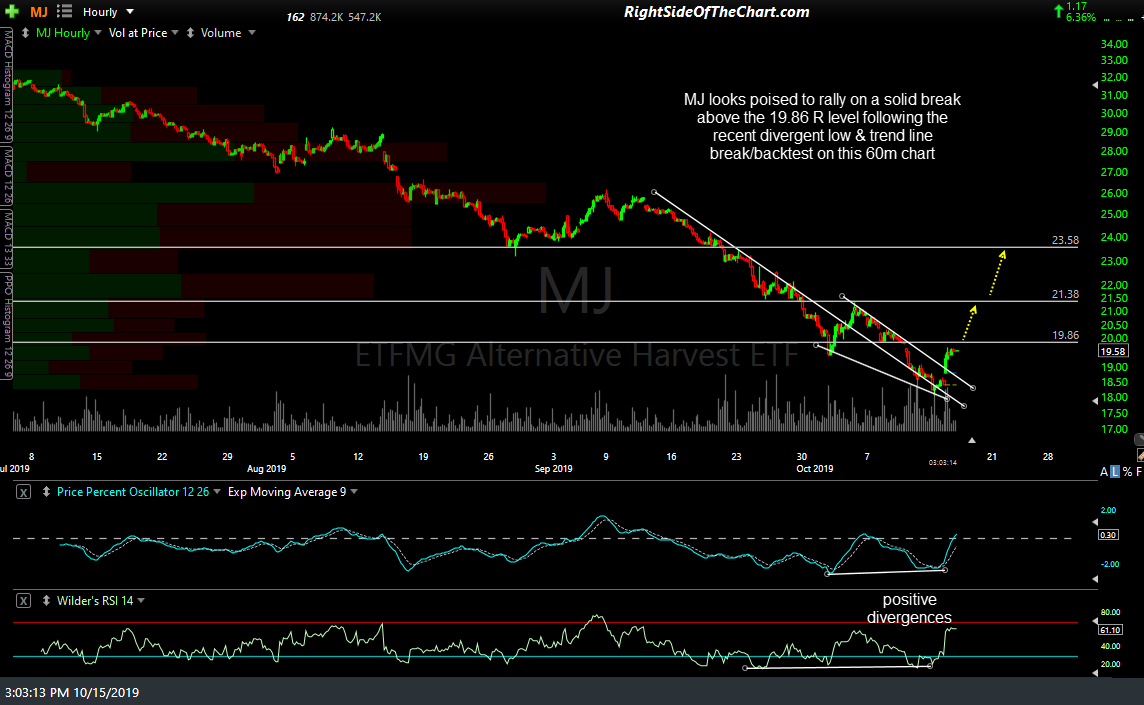
MJ 60m Oct 15th