
Today’s widely anticipated DC kick-the-can-even-further rally gave us some mixed signals which have somewhat obscured the technical picture. Starting with the bullish case, the $SPX did manage to close comfortably back inside of the recently broken bearish rising wedge pattern, effectively negating the recent sell signal. The Russell 2000 Small-cap Index managed to post an impressive 2.5% gain after hammering to close right on the bottom of it’s large rising wedge pattern yesterday (including a brief, intra-day “fake-down” below the lower trendline). The $DJIA finished with a strong ramp into the close which also took prices back above it’s recently broken uptrend line. All-in-all, there were certainly some bullish technical developments today.
On the bearish case, or more accurately the potentially bearish case, the two most important indices, the S&P 500 & the Nasdaq 100, closed at horizontal resistance as well as key Fibonacci retracement levels which are typically hit during counter-trend rallies. The $NDX (QQQ) close just slightly above the 61.8% retracement level which was highlighted earlier today while the $SPX (SPY) closed essentially right on the 50% retracement level of it’s prior drop from the Sept 19th (Fed meeting induced) all-time high. Therefore, bears can argue that today’s news induced rally was nothing more than a typical counter-trend move in an on-going downtrend which may have run it’s course today while the bulls can argue that the recent false breakdowns were nothing but bear-traps in which to provide the fuel to propel the market to new highs in the coming weeks/month. Personally I still believe that the longer-term (daily & weekly charts) remain clearly bearish and that any upside from where the markets closed today is limited. However, as stated earlier today, with the $SPX (the single most important index, IMO) now trading back above the bottom of the wedge pattern, I do not plan to add short exposure until/unless prices move back below that level soon. Basically I’m in wait & see mode and with volume likely to be light tomorrow with the quasi-holiday (Columbus Day), it will probably early next week before we can get a good read on things.
-
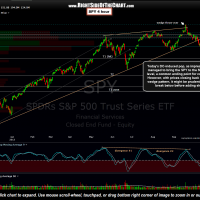
- SPY 4-hour Chart
-
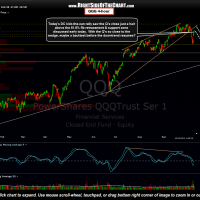
- QQQ 4-hour Chart
-
- New “Live Chart Links” Page
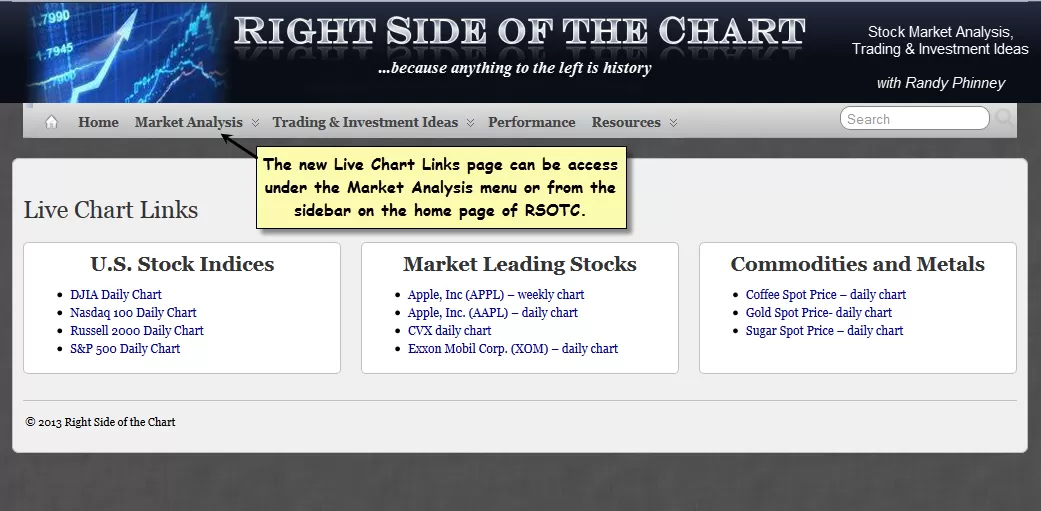
The updated SPY & QQQ 4 hour charts are posted above along with a screen-shot of the new Live Chart Links page that was added to the site today. Those links can be accessed under the Market Analysis section on the gray menu bar at the top of the page or by clicking on Additional Chart Links… in the Live Chart Links widget box on the sidebar of the Home Page. This new feature on the site is a work in progress so check back often as new charts and categories will be continue to be added over the next few weeks to months.