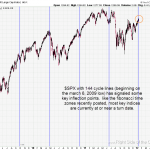
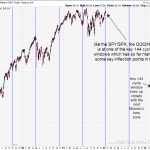
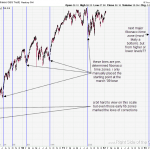
Last week I posted several charts of the major indexes with Fibonacci Time Zones which can be referenced in the posts below. Here are a few more that show both the fib time zones as well as the key 144 cycle lines. Here’s an article discussing these 144 Fibonacci cycles. This article was published in back on May 14, 2010 but make sure to check out the 2nd paragraph below the graph towards the middle of the article. They mention two key cycle dates cluster together on June 18th & June 19th. The 19th fell on a Saturday so pull up a daily candlestick chart of the SPX, NDX, etc.. and place your cursor on Monday the 21st. Coincidence that the market peaked on that day AND began a very powerful 10-day sell-off that nearly rivaled the flash-crash? Maybe. However I will say that just too many of these lines, which are at pre-determined intervals, line up nearly perfect, more often then not, with minor to major inflection points in the market. Like everything else in Technical Analysis, these turn-dates should not be used as stand-alone indicators, but rather in conjunction with other factors to help confirm or refute your current analysis… or maybe just to be a somewhat more cautious with your holdings around these windows, especially if positioned heavily with the prevailing market trend. Here are a few more of those charts:

Results for {phrase} ({results_count} of {results_count_total})
Displaying {results_count} results of {results_count_total}