
My replies to a couple of questions today:
Q: As always, appreciate your analysis and charts. I have noticed that 43/17 Weekly long term indicator is now bearish on SPY by a good margin. This indicator combined with a shooting star candle from this week, indicating another major week down next week? Not to mention the pennant which may very well break down in the direction of move.
A: Yes, if we print a red or even a flat close today, this will be the 2nd consecutive weekly close with the 17 week ema below the 43 week ema on not only the SPY/$SPX but also just about every other diversified equity index except the $NDX & it’s closely related cousin, the $COMPQ.
Beside the $SPX, all of these other key US stock indices are currently poised to print a first or second consecutive weekly close with the 17-week ema below the 43-week ema: $DJIA (Dow Jones Industrials), $DJA (Dow Jones 65 Composite… a combination of the Dow Industrials, Utilities & Transports), $MID (S&P 400 Mid-cap Index), $RUT (Russell 2000 Small Cap Index), & $WLSH (Wilshire 5000 Index). Essentially, all major diversified stock indices in the U.S. have triggered intermediate to long-term sell signals via this trend indicator which has done an exceptional (although not perfect) job of signaling primary trend changes (bull & bear markets) in the past.
It is worth noting that until the Nasdaq 100 & Nasdaq Comp also confirm, these could prove to be whipsaw signals. Even if the $NDX & $COMPQ trigger death crosses on the 43/17 ema pair, that does not assure that the market will or must head much lower, it only increases the probability. With that being said, the fact that these trend indicators (along with nearly all of my shorter-term trend indicators) have recently turned bearish FOLLOWING breakdowns below the primary bull market uptrend lines on every major US stock index, provides enough evidence that the primary trend is now bearish and as such, one should favor shorting rallies into resistance vs. a strategy of buying dips to support (as support levels are more likely to be broken in a primary downtrend).
With today being OpEx (options expiration), my guess is that they’ll hold the market up into the close to roast the recent put buyers, with the next big wave of selling to start next week assuming that prices move back down well below those 60-minute uptrend lines. As I type, both the QQQ & SPY are back testing the 60-minute uptrend lines that were pointed out in the post earlier today. Should they regain those trendlines, I’d expect the markets to find resistance on a backfill of today’s gap (i.e.- yesterday’s lows).
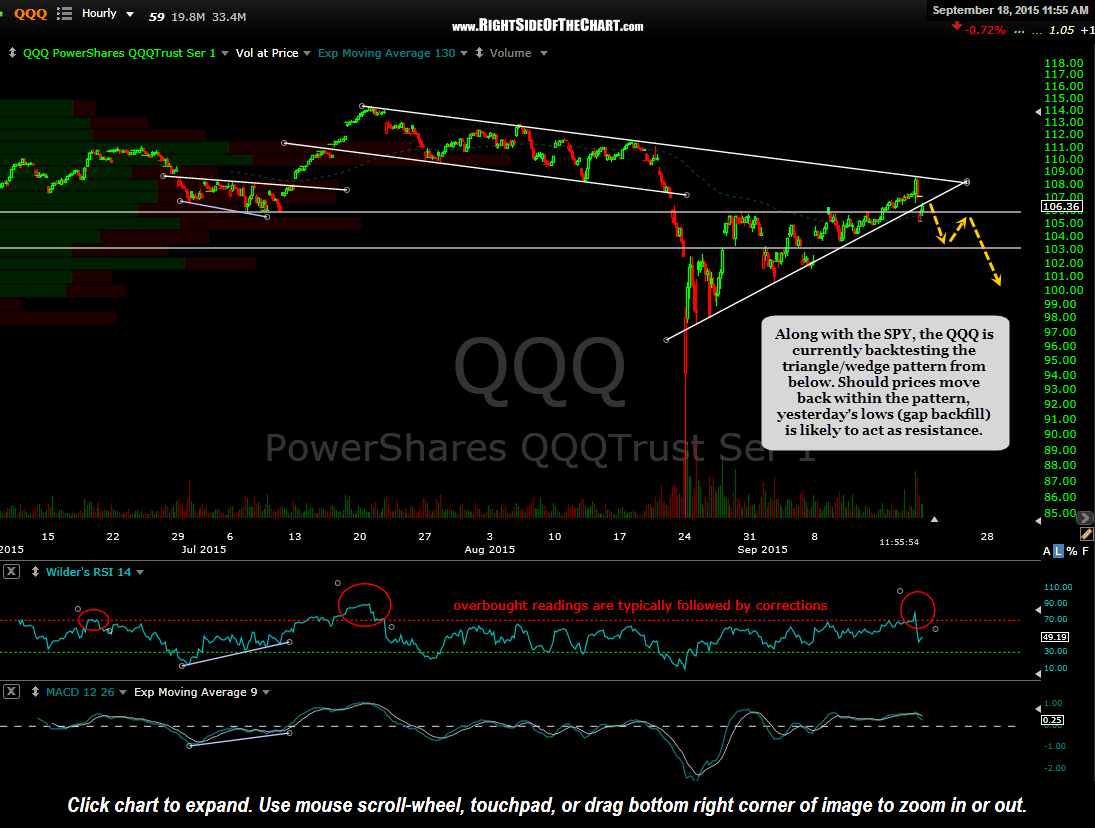
QQQ 60 min 2 Sept 18th
Q: : you stated aapl a short entry if it hits 117 which is did earlier this week(117.25) but then you wrote…While I was away, I can see that AAPL came within pennies (11 cents to be exact) of my 117 short entry criteria on Monday..does it have to close at that level or just hit it intraday??
A: I show AAPL hitting a high of 116.89 on Monday from three of the charting services that I use. I know that it is not uncommon to see one charting service report an erroneous high, low or close for a stock. What charting or quote service reported that high and on what day (I assume Monday?).
To be honest, 116.89 was close enough that I most likely would have shorted had I been around to do so (I took the family to Universal Studios Sunday thru Tues night, a 3 hour drive each way, & stayed off the computer the entire time).
If you shorted AAPL then, I think that you had a very objective entry as the stock may not see those levels again for a long, long time. If I’m wrong, a stop somewhat above the 117 area (anywhere from 2-3% above or higher, depending on your downside targets) would give you a minimal loss if stopped out with the potential for very large gains, should the stock move much lower in the coming months as I suspect.
Best of luck if you are short & let me know if you have any questions or you are able to confirm that high of 117.25 via an additional source.
additional comments that I meant to add to that reply: Unless stated otherwise, a trade idea will trigger an entry on any intraday move above/below the stated entry price. The entry criteria for AAPL remains any intraday move at or above 117 but no higher than 119 as per this Sept 3rd post). The reason for capping the entry price below 119 is because AAPL would have regained the key 40-week ema/200-day ema above 119. note: In the Monday Morning Commentary this week, which was actually posted on WEDNESDAY morning (due to brain still in vacation mode & having just started out my work week) I had mistaken reiterated the entry criteria as between 117 to no higher than 120. That typo has now been corrected.