remember, try not to get too caught up in all the noise and confusion found in the intraday charts if you are a swing trader or investor. the bigger picture remains bearish, however, the daily & weekly charts hardly change on a day to day, especially on an intraday basis so i’ll usually only update those from time to time unless something changes or jumps out at me. hence, all the 60 minute chart postings lately.
the intermediate trend since late march/early april of 2012 still remains down just as the short-term trend since early june remains up. a solid case can also be made from both a technical as well as a fundamental perspective that we are in the early stages of a bear market although it is still too early to confirm that and as such, the primary trend remains up, at least technically speaking until the june 4th lows are taken out, putting in a new lower low. also, remember that the intermediate uptrend remains intact unless/until the july 12th lows give way. that may or may not happen but i still favor that scenario, regardless of any one-day short-squeeze attempts via coordinated global central bank jawboning, like we saw today.
of course, the market can go higher as well so let’s see what kind of follow-up we get tomorrow and early next week. i’m still giving my short trades some room on their stops and also still waiting until the 7/12 lows break before getting very aggressive, possibly all-in on the short side. the stops on my shorts will be determined on an individual basis, not on any specific level in the S&P or NDX. this market continues to frustrate both longs and shorts with very choppy, unpredictable intraday gyrations. large gaps in either direction on a daily basis have made holding any overnight positions a crapshoot and being in the thick of earnings season doesn’t help.
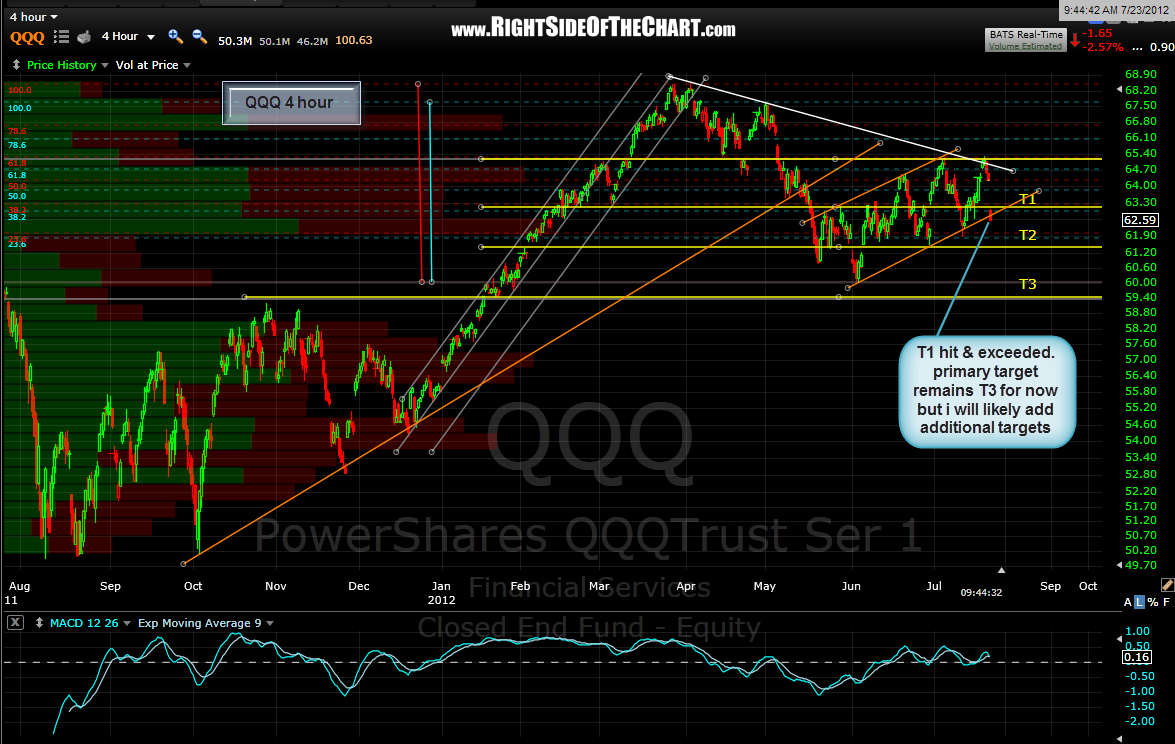
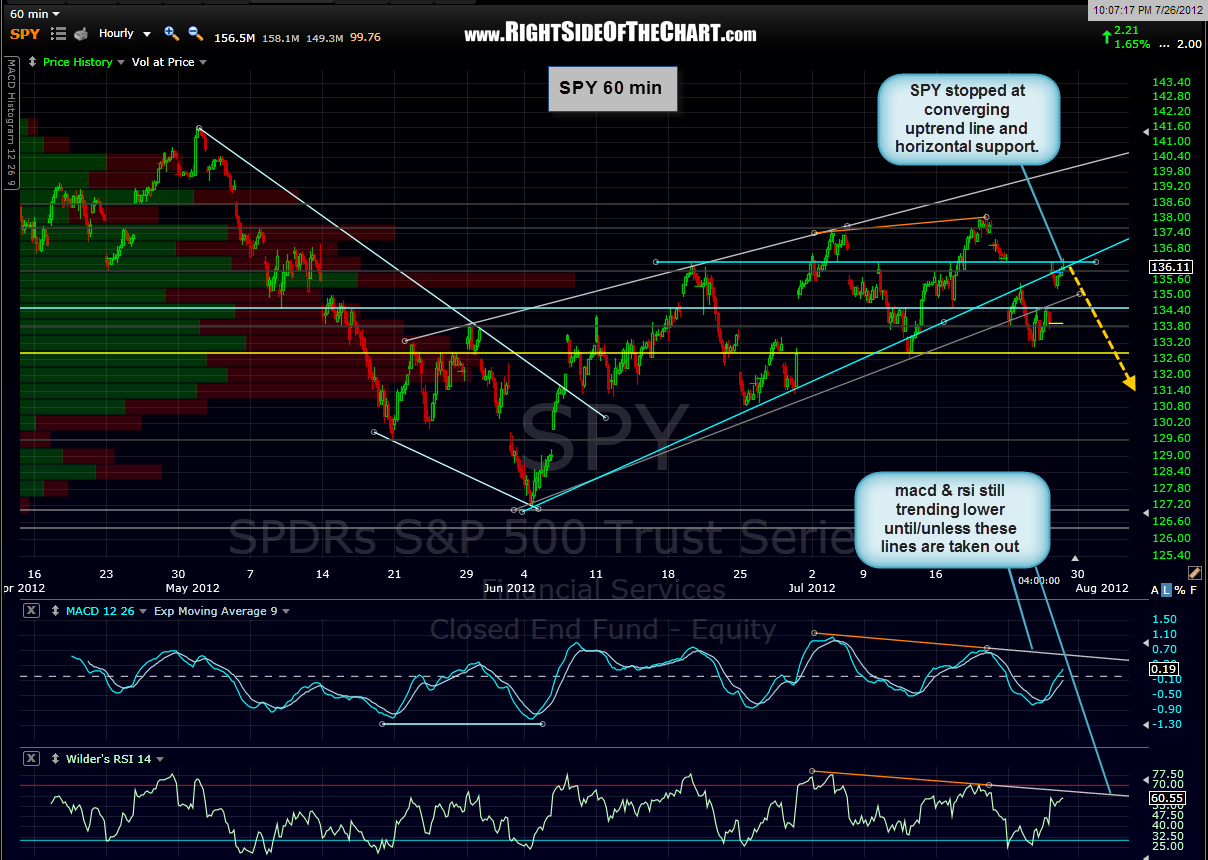
i mentioned recently the possibility of adding more etf’s to the trade ideas sections but i’ve held off as i can’t fathom trying to game the broad indexes or sector etf’s with all the recent virtually unpredictable chop and slop. i continue to trade the best looking individual stock patterns, long or short, although i have moved to an overall short bias recently. time and time again i’ve notice that on balance, the best looking chart patterns tend to play out more often than not, even when the overall market trend is unclear and often, when the trend is not inline with those trades. with that being said, here are the 60 minute SPY & QQQ charts. i’ve cleaned them up a bit by darkening some of the minor support & resistance levels and focusing on the nearby salient levels (blue or yellow lines).