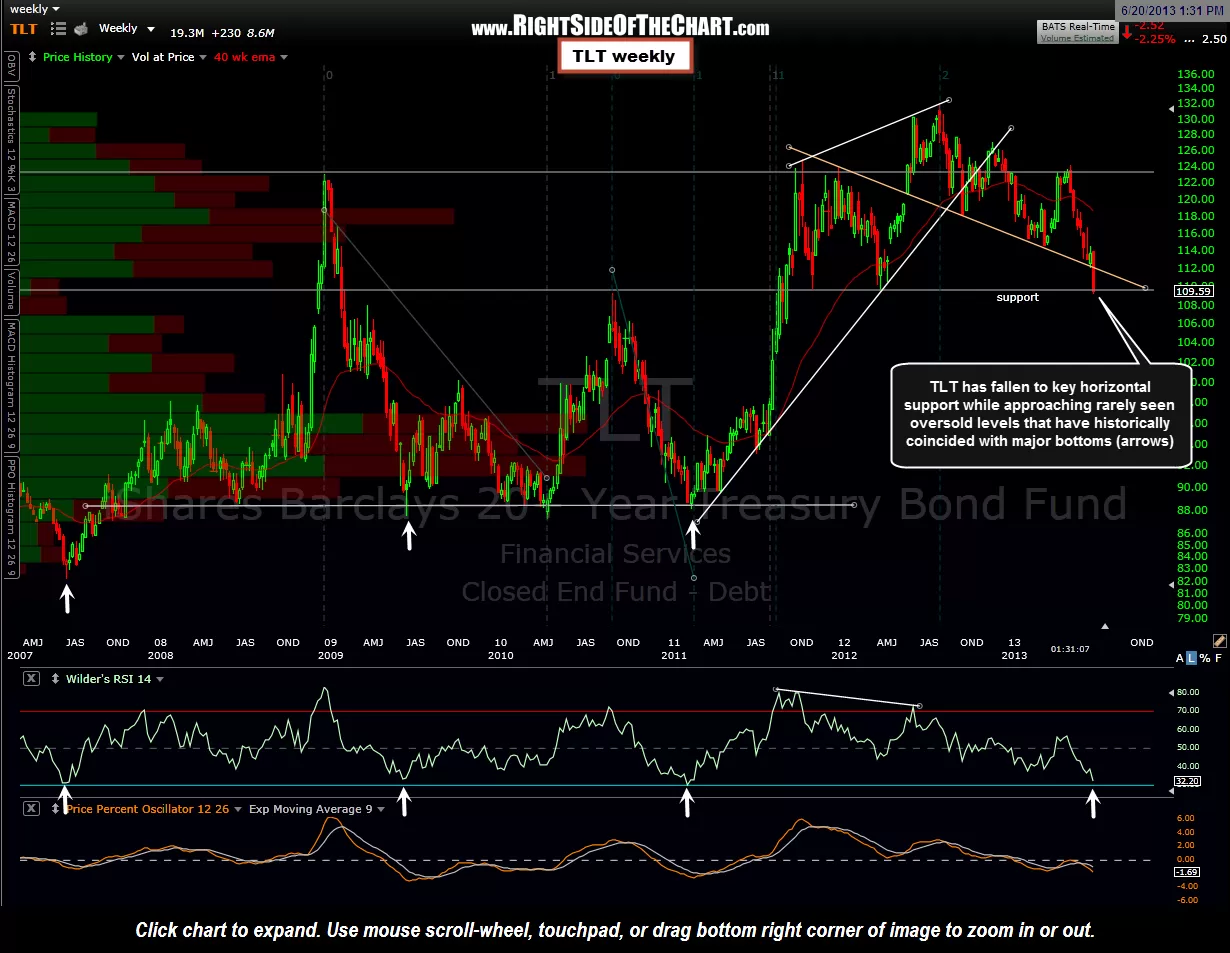
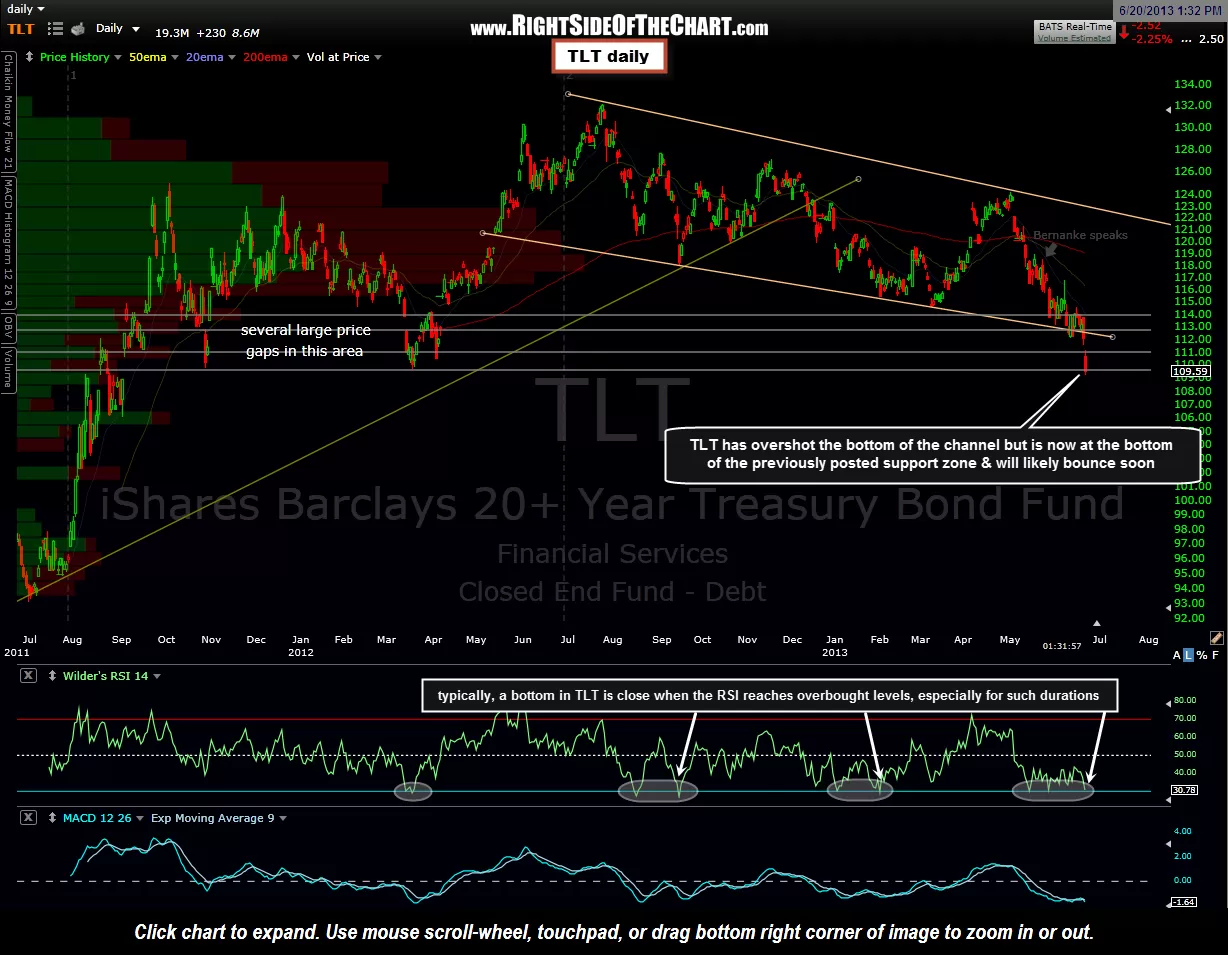
I’m adding the Long Bond (the nickname for 30 year treasuries) via TLT here as an active long trade around current levels, hence, I’m going long Long-bonds. Although TLT has overshot the bottom of the recently posted descending channel, it is still within the support zone that was posted on that chart. In fact, it’s not only at the bottom of that support zone but TLT has also fallen to a key support level on my weekly chart while approaching oversold levels (on the weekly RSI) that have signaled immediate and significant bottoms on every move to this level over the last decade. That does not mean that history must or will repeat but it does mean that TLT is offering an objective long entry here with the appropriate stops in place.
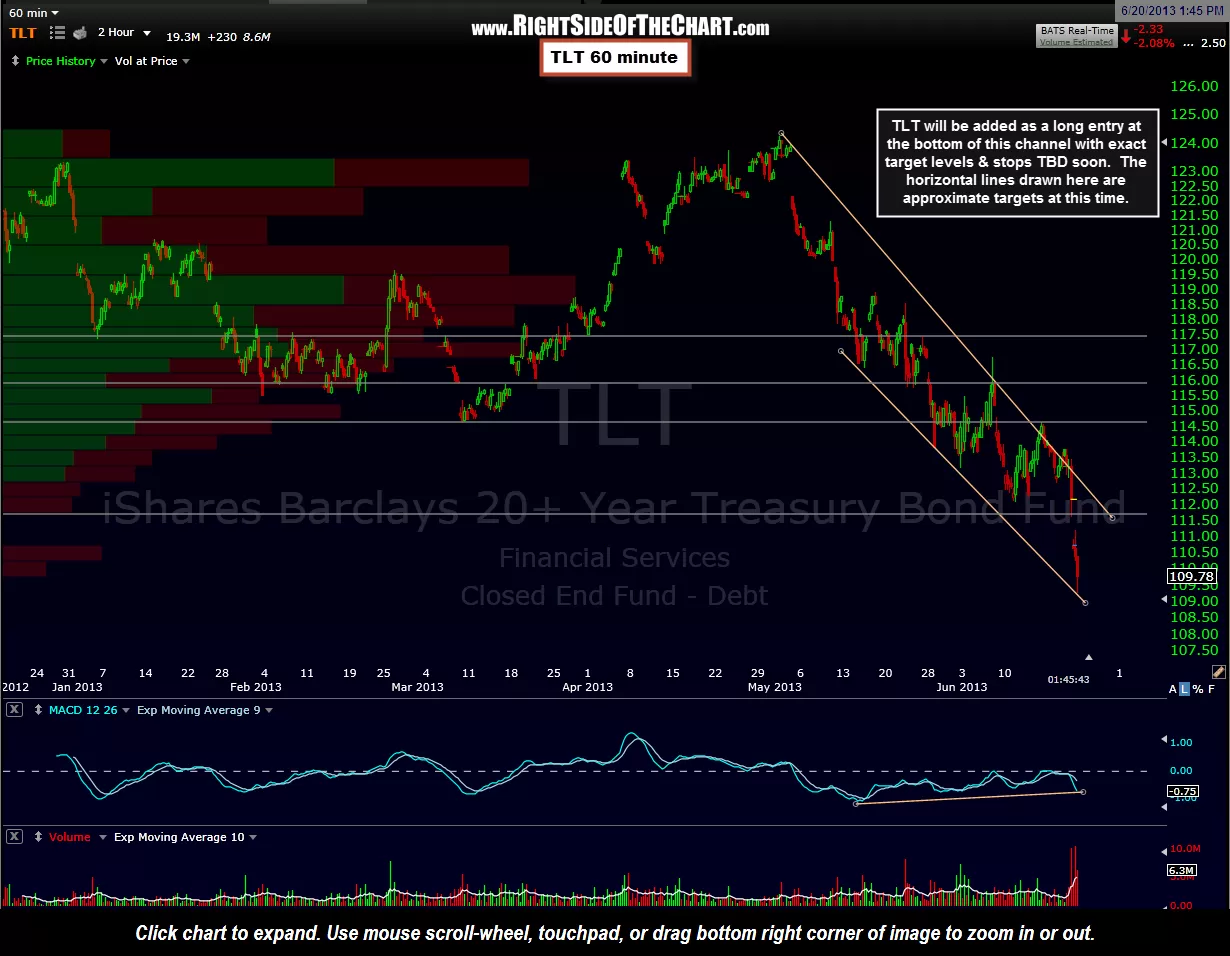
Just for clarification, I still believe that the ZIRP bubble has finally been pricked and that we have most likely seen THE bottom in rates. I am just viewing TLT as a relatively short-term (days to weeks) bounce trade off current levels. The exact targets & suggested stop levels TBD soon but the 60 minute chart below has a few horizontal levels that I will likely be targeting. As TLT is a very low beta trading vehicle, my preference is to use a 1.5 – 2.0x position size for the trade. Weekly, daily, & 60 minute charts: