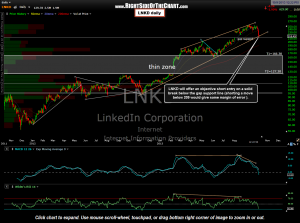
 LNKD was last posted as an objective short entry back on June 12th while just below an area of intersecting trendline resistance (with the caveat that prices must remain below that level). Unfortunately LNKD went on to break out above the downtrend line (a bullish technical event) shortly thereafter with prices moving higher although within a larger contracting channel with divergences building on the MACD & RSI. After several weeks of tapping against the top of the pattern, prices rolled over and have recently moved down sharply to hammer (so far today) off the bottom of the pattern (orange uptrend line). Note that the tail of today’s hammer candlestick happened to overshoot the pattern but make a nice kiss of the huge Aug 1-2 gap, a very key support level. As the nearly 1 year old uptrend line that defined the bottom of the pattern is a very important support level, a solid break and/or close below that level would be bearish. However, with that key gap support level sitting just below, my preference would be to wait for a solid break below that level before initiating or adding to a short position. The bottom of that 8/1-8/2 gap is at 213.48 so one could either short any move (or close) below that level or maybe wait a few points, say on a move below 209, to allow for some margin of error in case of a brief overshoot of support/fake-down move by big money to run the stops. Updated daily chart:
(note: As the previous LNKD trade took out that previous discussed downtrend line and the trendlines and pattern on this updated chart have been adjusted with a new pattern added, those previous posts will be moved to the Completed Trades category as a stopped out trade. Therefore, LNKD will only be assigned to the Short Setups category for now, until/unless the new entry criteria is met.

