
The LL (Lumber Liquidators Holdings) Active Long Trade has broken above this symmetrical triangle consolidation pattern (10 minute chart) which could be the catalyst for the next thrust higher. White horizontal lines mark some near-term target/resistance levels while T3 (23.15) remains the next swing target on the daily time frame.
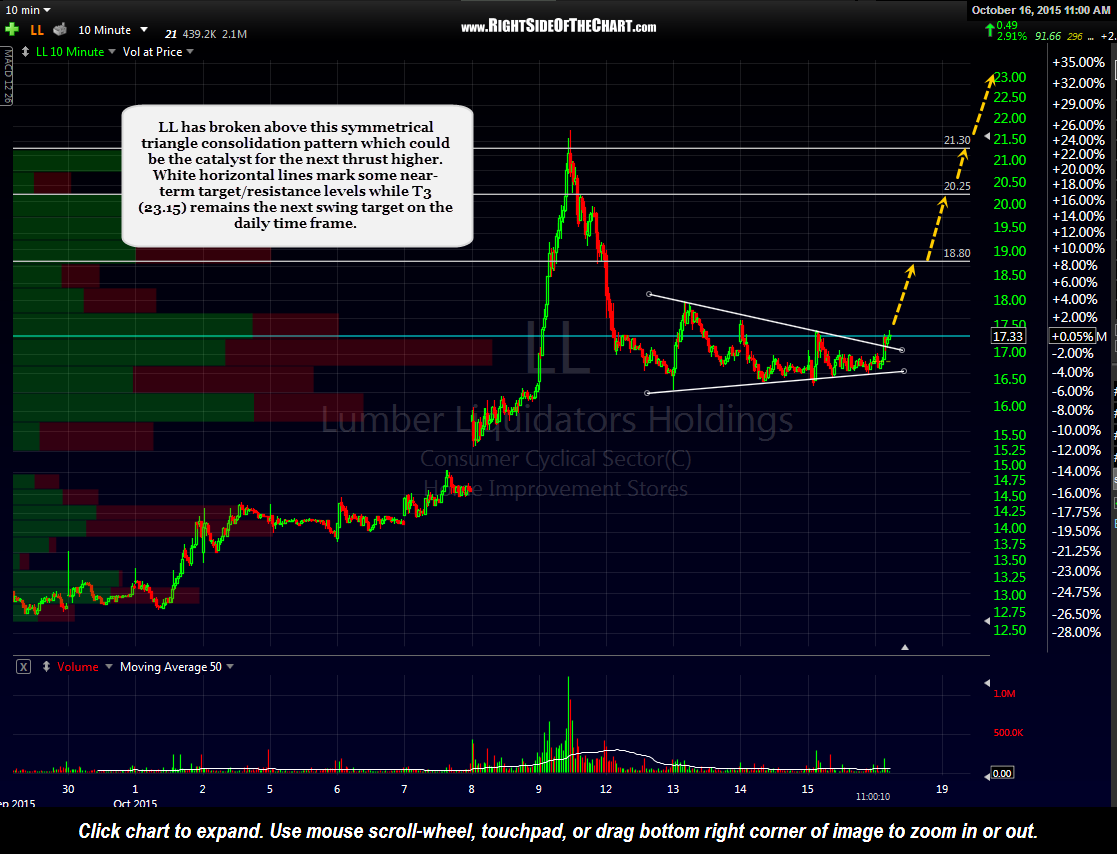
LL 10 minute Oct 16th
In the previous update, it was pointed out that LL had pullback back to this support zone. In addition to the fact that prices are now trading above the zone, LL also has the potential to make a bullish MACD crossover & backtest of the zero line (which often acts as support when tested from above while a trend is bullish/resistance when tested from below in a downtrend). I also like to use the 13/33 ema pair to help define/confirm short to intermediate-term trends on the 60-minute time frame. As of now, that pair remains on buy signal with the ema pair current kissing. Any upside from here would mean that the pair kissed & bounced (bullish) while any considerable downside would result in a bearish crossover of the pair, which would be the first warning sign of a potential trend change.
As of now, I remain bullish on LL and favor a resumption of the recent uptrend but will adjust my positioning accordingly, should the bearish developments mention above start to play out. As LL may likely have already completed the much needed pullback (to alleviate the extreme near-term overbought conditions), I will add it back as a trade setup (in addition to remaining both an Active & Completed Trade, already hitting 2 of the 3 price target) because the stock once again offers an objective new long entry or add-on based on the symmetrical triangle breakout & the other developments mentioned above.
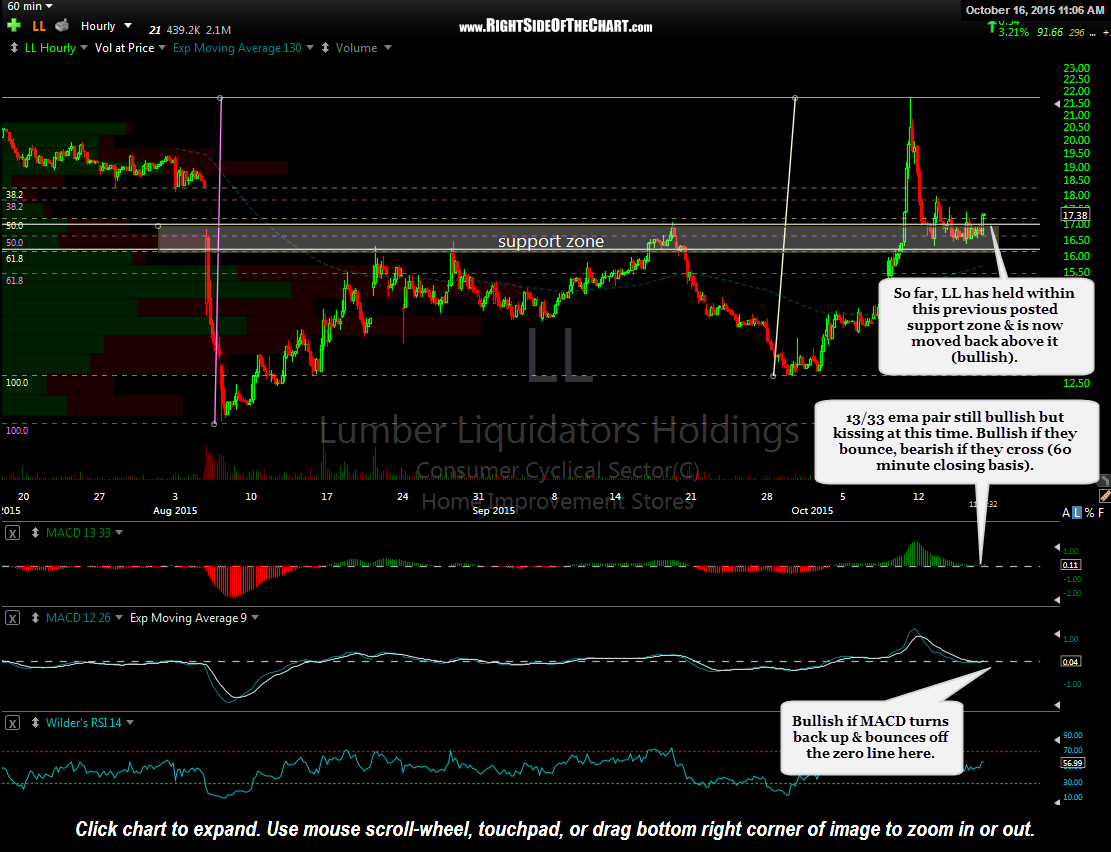
LL 60 minute Oct 16th