
KRE(Regional Bank Sector ETF) is on watch for as a potential long swing trade after falling to long-term support while deeply oversold with potential bullish divergences. The first chart above is a weekly (6-day period) chart with KRE falling to both its 10-year primary bull market uptrend line and intersecting 45.45 price support level while at the deepest oversold readings since the 2007-2009 bear market. The next chart is a 2-year daily chart showing the extreme oversold conditions following the 31% plunge off the early June divergent high.
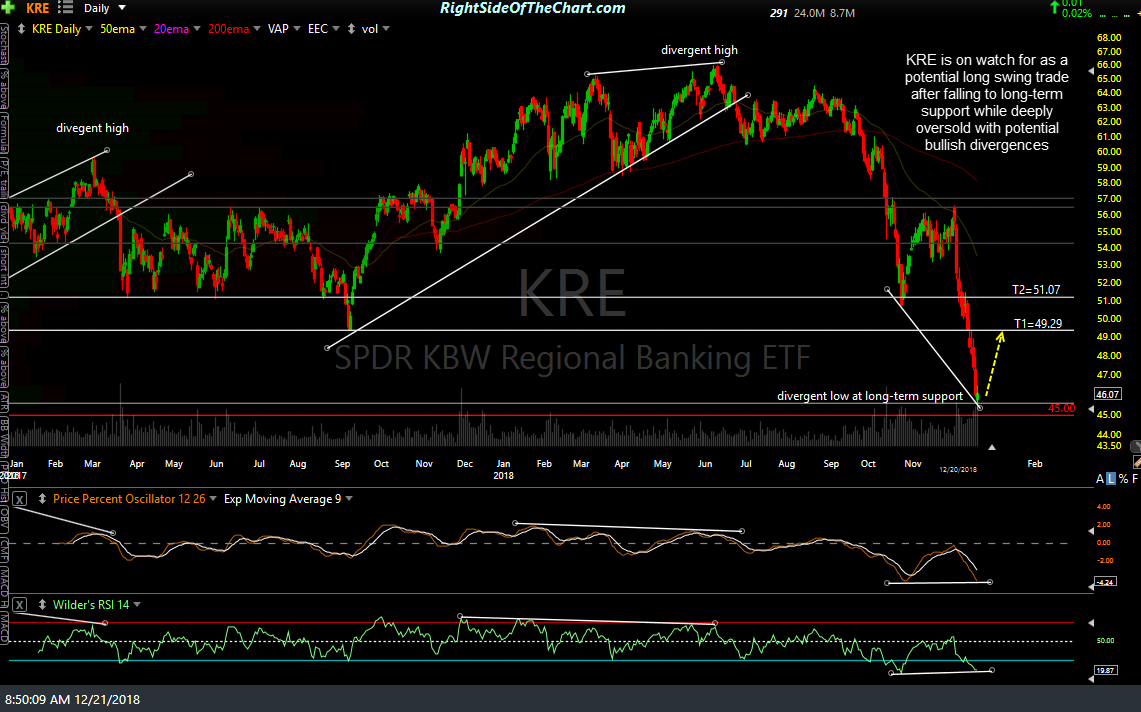
KRE daily Dec 20th close
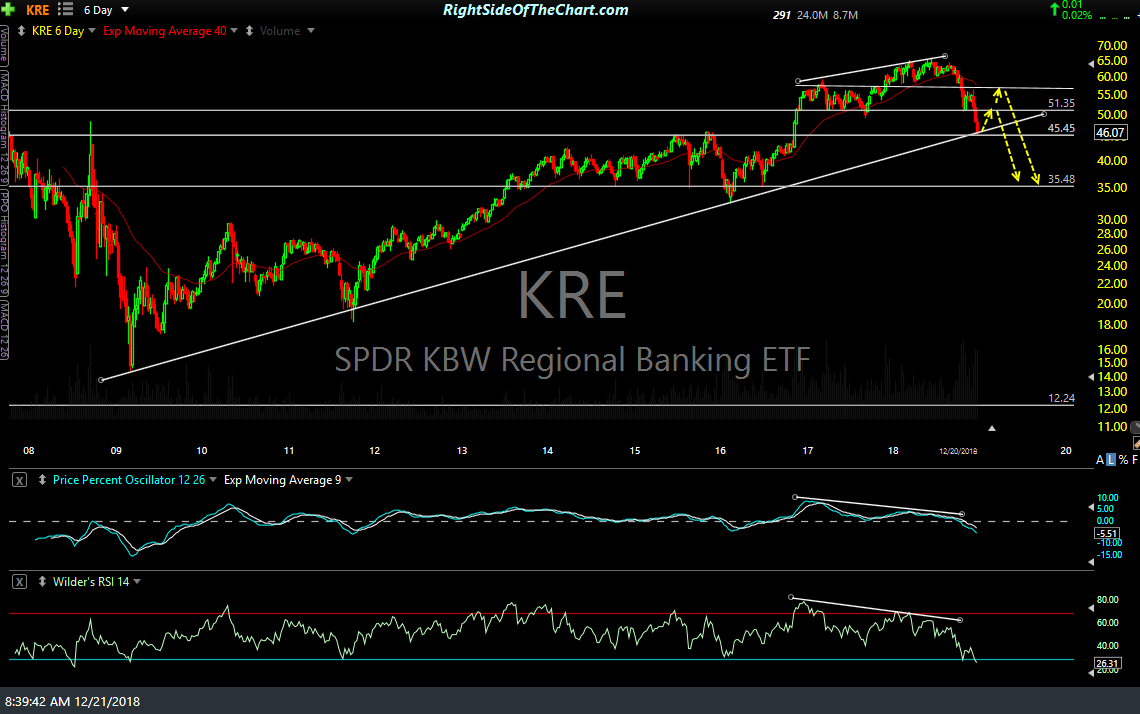
KRE weekly (6-day) Dec 20th close
I wanted to pass along this trade setup in advance as I may add it on short notice once it appears that the current wave of selling has likely run its course. Should this become an active trade soon (remember, a trade setup is only a potential trade candidate), the price targets will most likely be as labeled on the daily chart with T1 at 49.29 & T2 at 51.07. The suggested stop will depend on the entry price but if KRE reverses from at or near current levels, the stop will most likely be on a move below 45.00, if targeting T2.
As it appears that the bull market off the 2009 lows in the regional bank sector most likely ended with the June highs, I am viewing this as counter-trend trade & will most likely look to position short once it appears that the next rally has likely run its course.