KO is one of the largest components of the S&P 500 and looks to be a relatively low-risk short and/or a nice candidate to provide some hedging exposure against a net long portfolio. As a mega-cap company in a stable industry, KO has is a relatively low-risk, low volatility trade whether long or short. Like all shorts right now, it is a counter-trend trade but as I combed through the charts over the weekend, I noticed that a fair number of the more bearish charts that I came across were in my top 25 $SPX holdings watch list (several others, such as CVX, XOM, and four of the big five TBTF banks; JPM, BAC, C, WFC).
My take on hedging is this: If an investor has a well diversified portfolio of large cap stocks and decides to hedge via a short or puts on the $SPX and the market drops, then they are likely to experience a wash. In other words, if the market drops 10%, their $SPX short hedge goes up by 10% but their diversified large-cap portfolio would also drop by about 10%. When hedging a net long portfolio, it only makes sense to select the most bearish patterns on specific stocks vs. using a broad market proxy (etf, index futures, puts, etc..) which would be shorting the most bullish stocks along with the most bearish stocks in that index.
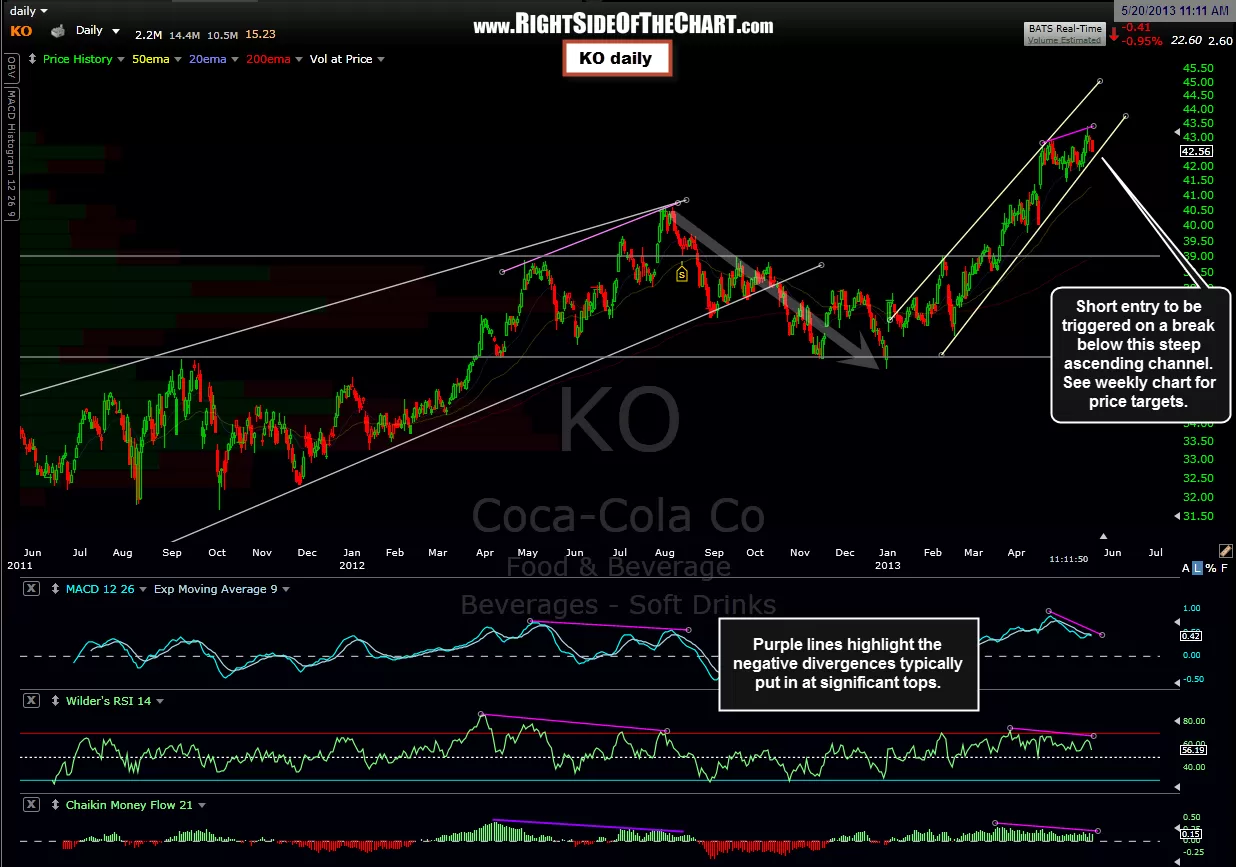
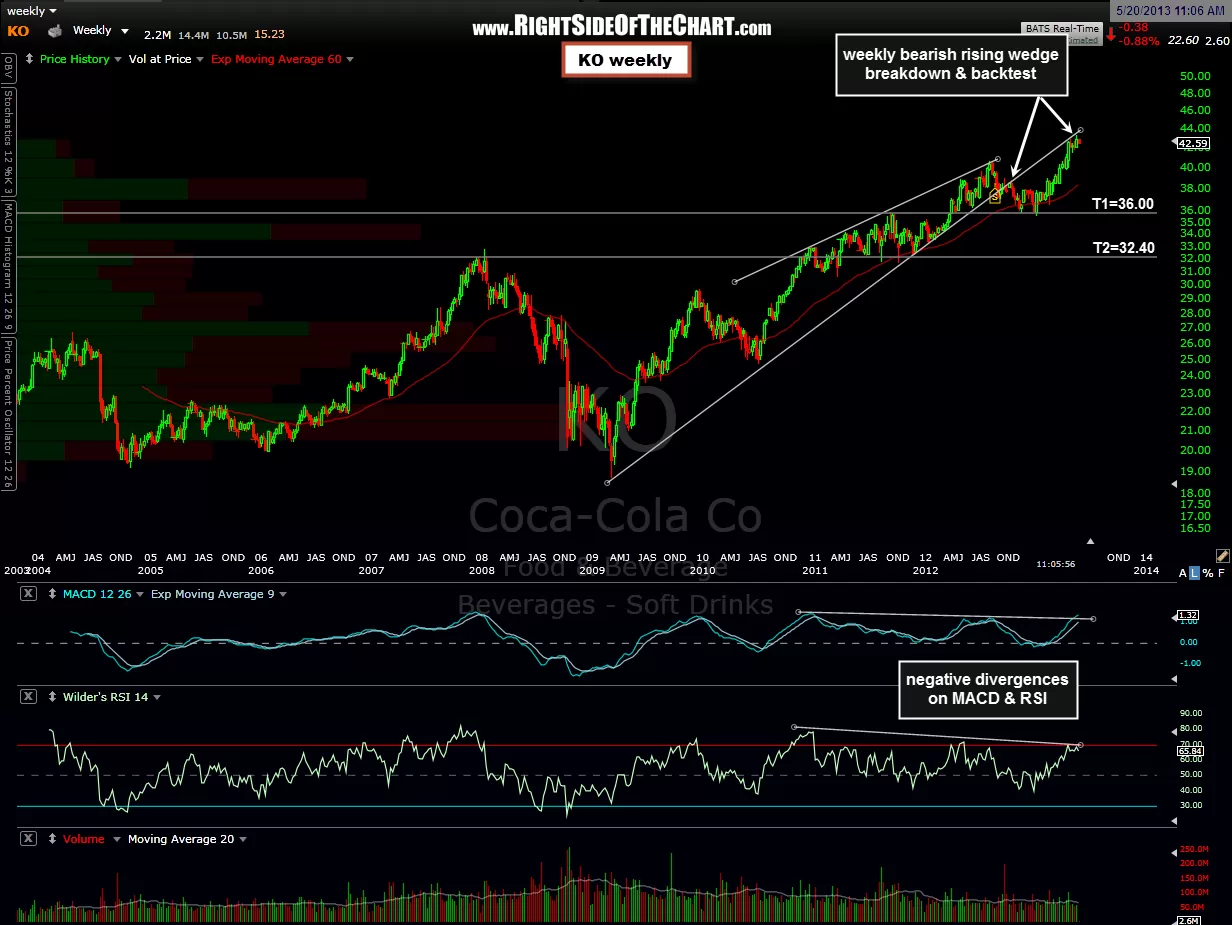
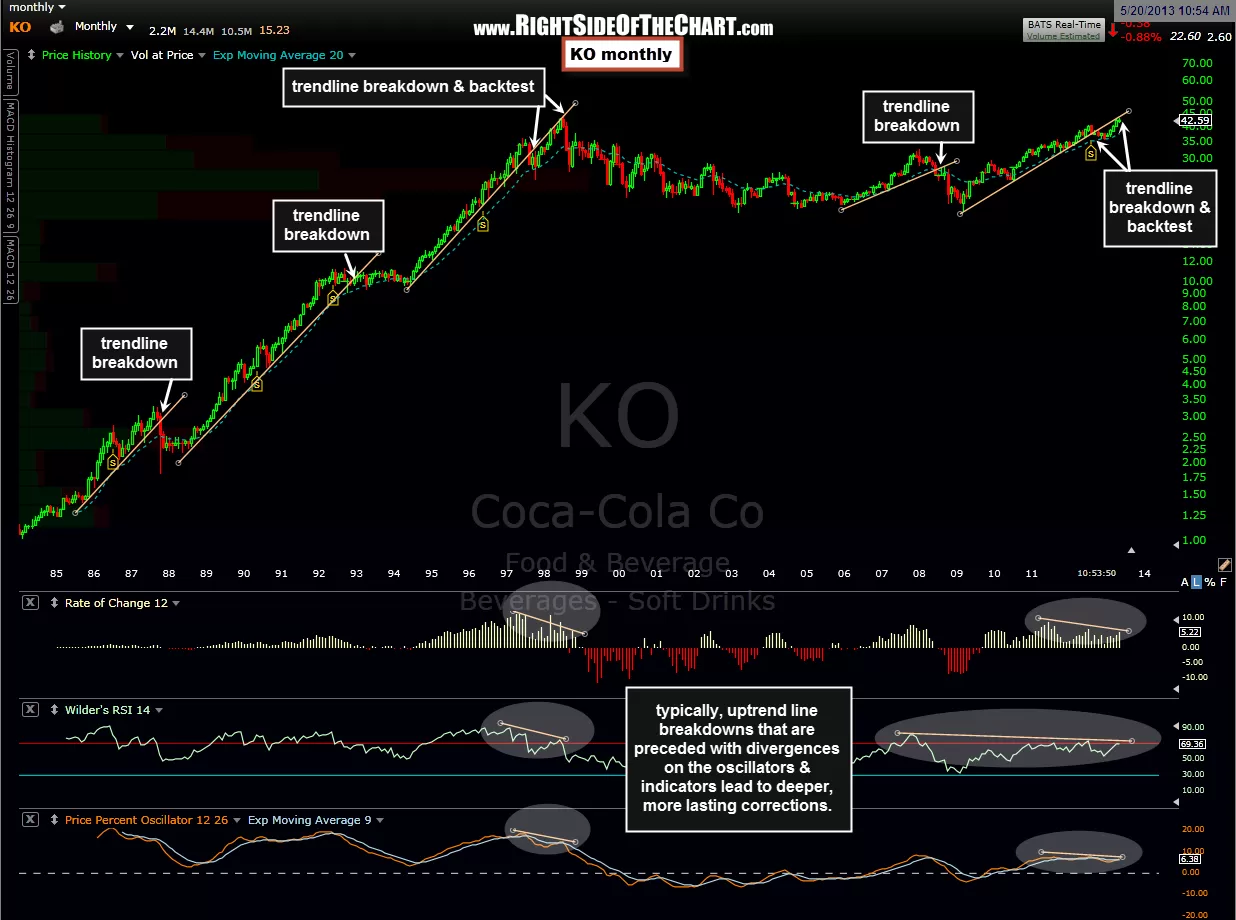
With that being said, here are the monthly, weekly, and daily charts making a case for a KO short trade with a short entry to be triggered on a break below the steep ascending channel on the daily chart and the price targets as shown on the weekly chart.