
KHC (Kraft Heinz Company) has certainly had its share of issues in recent years, falling over 70% since the stock’s all-time high back in early 2017. While the stock would likely continue to face some headwinds if my call for a bear market in the major stock indexes in 2019 & beyond plays out, A) that bear market scenario may or may not come to fruition and B) even if it does, that does not necessarily mean that KHC won’t or can’t buck the trend and rally as there are always a subset of stocks that rally in bear markets just as there are those that fall during bull markets. Regardless of whether the trade pans out or not, my job is to pass along the best looking trade ideas regardless of my own views on the market. As with any trade idea, one should pass on KHC if it does not mesh with their trading style, objectives or outlook on the market.
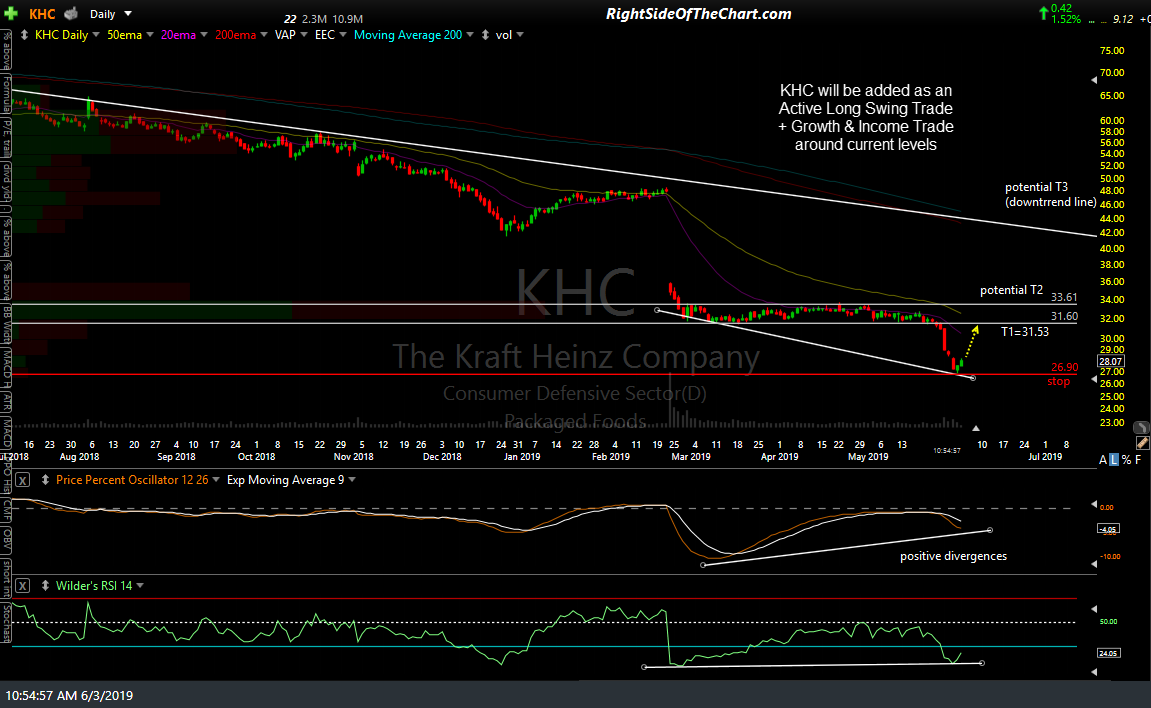
KHC daily June 3rd
Although I have not looked into the stability of their dividend & would encourage you to do your own due diligence on the company, at this time the stock is yielding a dividend of 1.60/share for an above-average yield of 5.7% Never buy a stock based on the dividend alone, especially those with unusually high dividends as there is a decent chance that the dividend could be at risk of being cut. Quite often, dividend cuts on a stock are expected and already fully priced in by the market by the time the cut is effected but if not, an unexpected or larger-than-expected cut can cause a sudden & sharp drop in the stock.
With that being said, KHC will be added as an Active Growth & Income Trade idea as well as an Active Long Swing Trade around current levels (~28.12). The sole price target at this time is T1 at 31.53, which is set just below the 31.60 resistance level. Should the charts of KHC and/or the broad market continue to firm up, additional price target might be added around the 33.60 resistance level & possibly the primary downtrend line. The suggested stop is any move below 26.91 (i.e.- a print of 26.90 or lower, should the stock gap down beyond that level) with a suggested beta-adjusted position size of 1.0 (i.e.- a typical position size).
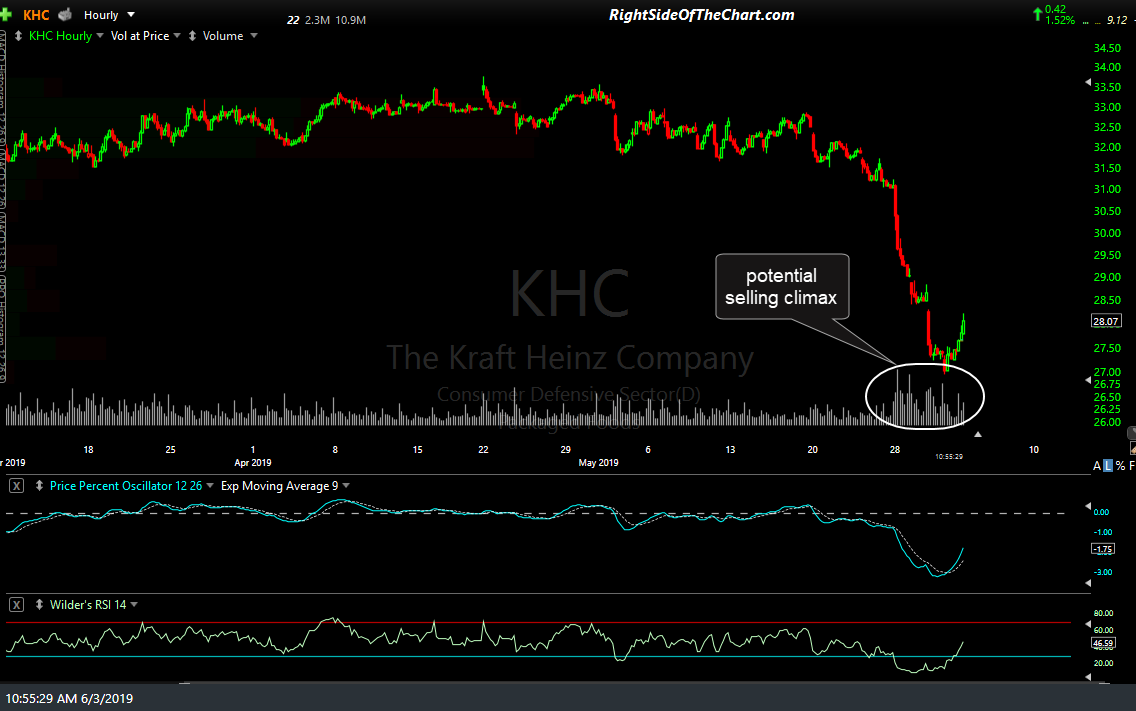
KHC 60-min June 3rd
In addition to the deeply oversold conditions & potential bullish divergences that have been building on KHC (which are not buy signals, merely indications that a trend reversal is likely), one of the reasons for the entry here is what appears to be a potential selling climax on the stock as shown on the 60-minute chart above. A selling climax occurs when a stock that has been in a prolonged downtrend suddenly has a sharp drop on high volume. This is often the result of the last of the weak-handed longs capitulating & throwing in the towel by selling their shares, thereby shifting the supply/demand dymanics in the stock with a more solid base of those holding the shares, many of which have bought the stock during the selling climax and as such, are not remorseful holders with large embedded losses just dying to get out on the first half-decent rally.