
HYG & JNK are the two most popular high-yield (aka- junk bonds) bond ETFs & both are current at or very near both key downtrend line & horizontal price resistance levels. While the MACD is still pointing higher, the possibility that junk bonds continue to rise & take out these resistances levels certainly exists as the trend remains bullish for now but based on how overbought these ETFs at this point along with my overall read on the charts, I favor a rejection off these resistance levels & a meaningful reversal from at or near currently levels.
-
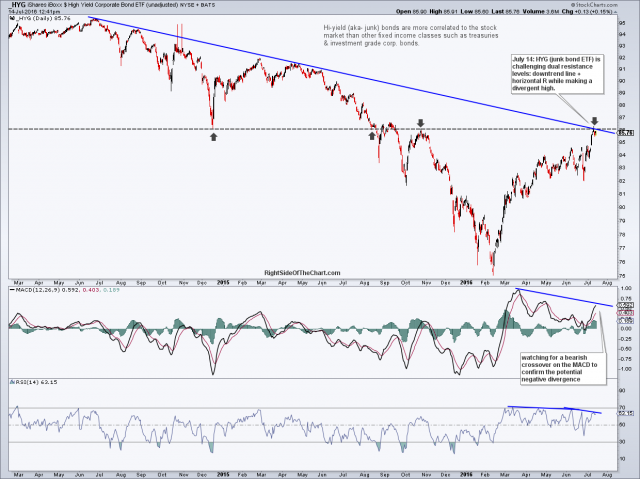
- HYG daily July 14th
-
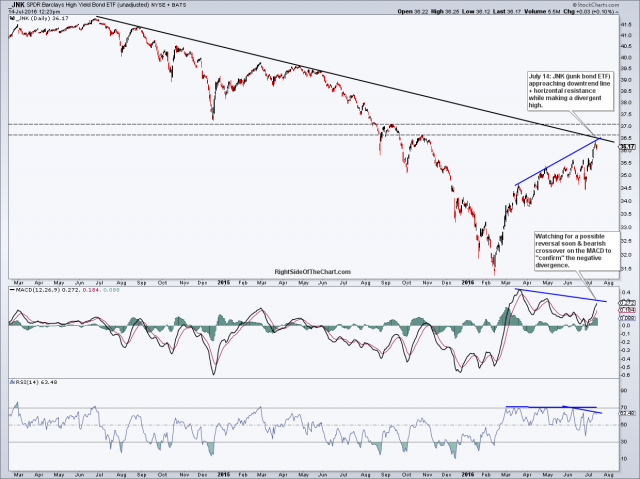
- JNK daily July 14th
With that being said, I don’t plan to personally short JNK or HYG nor add them as official trade ideas for a couple of reasons. First, these ETFs pay above average dividend yields (~6%) & while short a position, the short seller is responsible for paying those dividends. Second, other than shorting here at resistance with a stop somewhat above, I don’t see any well defined entry point other than a possible short entry on a break below the 30-60 minute uptrend lines off the June 27th lows. Finally, the pullback targets just aren’t very clear to me. However, I believe that these charts were worth sharing as a reversal in junk bonds would most likely correspond with or possible lead in advance of a pullback in the equity markets as junk bonds can often be used as an early indicator of problems brewing with the financial markets (i.e.- divergence when junk bonds fall while equities continue to rise).
Click on either of the following ticker symbols for a links to the live (prices updated when opened) charts of HYG & JNK.