
This first chart below showcases the nearly perfect inverse correlation between the stock market, as measured by the S&P 500, and the BofA Merrill Lynch US High Yield CCC or Below Option-Adjusted Spread, i.e.- junk bond spreads. For those not familiar with the term option-adjusted spreads (OAS), click here to view the definition. Admittedly, there are only a few previous instances of the disconnect between stock prices and high-yield bond OAS during the current bull market to compare. In fact, I could only identify three clearly identifiable instances including the current disconnect between junk bond OAS & equities (all three shown on the second chart below). However, every single correction in the $SPX was either accompanied by or, in those rare instances and numerous others when viewed over a longer period of time, including mid-2007, preceded by a disconnect between this ratio. This first chart is the aforementioned High Yield OAS index plotted against the S&P 5000.

Junk Bond OAS vs $SPX May 30th
In this next chart, I inverted the OAS which helps to provide an better visual representation of how tight the correlation between stocks and junk bond spreads are. This also allows me to highlight the few instances of divergences between the pair (although technically, divergence on that chart is actually positive correlation since I had inverted the OAS data… hence, down is now up and vice versa). Bottom line is that despite the apparent resiliency of the US stock market, which is really only slightly positive (S&P 500), flat (Nasdaq Composite) or negative (Russell 2000) for the year, this is just one more in a building list of caution signs that although the engine seems to be running fine, things don’t look so good under the hood right now. Divergences such as this and the recently highlighted $SPX-vs.-stocks-trading-above-their-200-day-ma are not a sell signal but merely a yellow flag warning that the S&P 500 may still not have dodged the bullet that recently took both the Nasdaq Composite & Russell 2000 each down by about 10%.
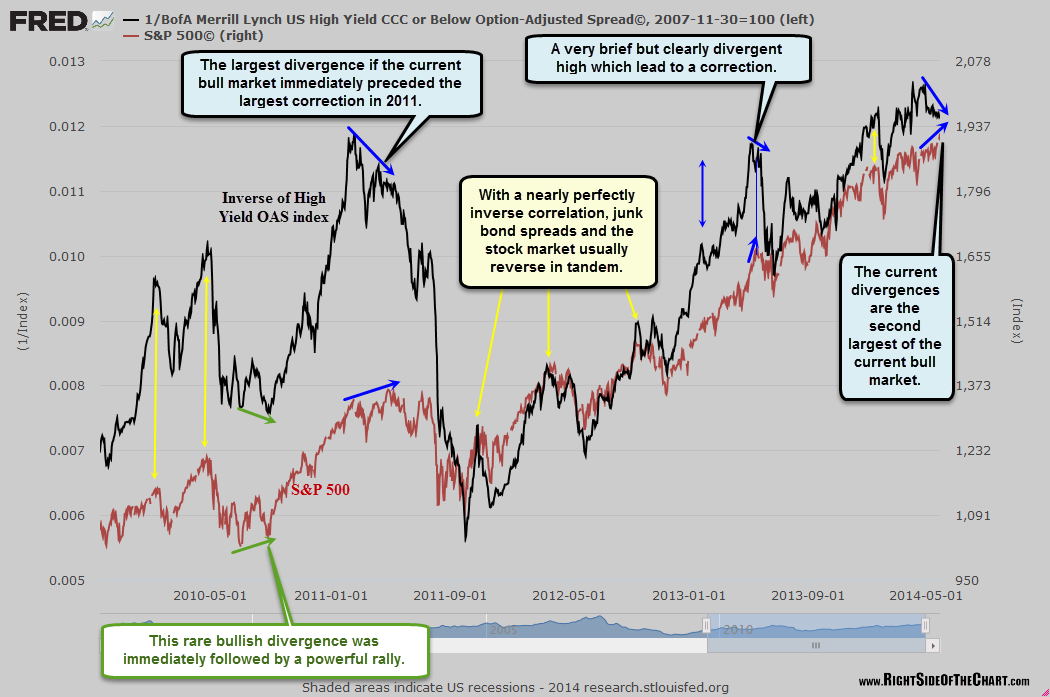
Inverse Junk OAS vs SPX May 30th