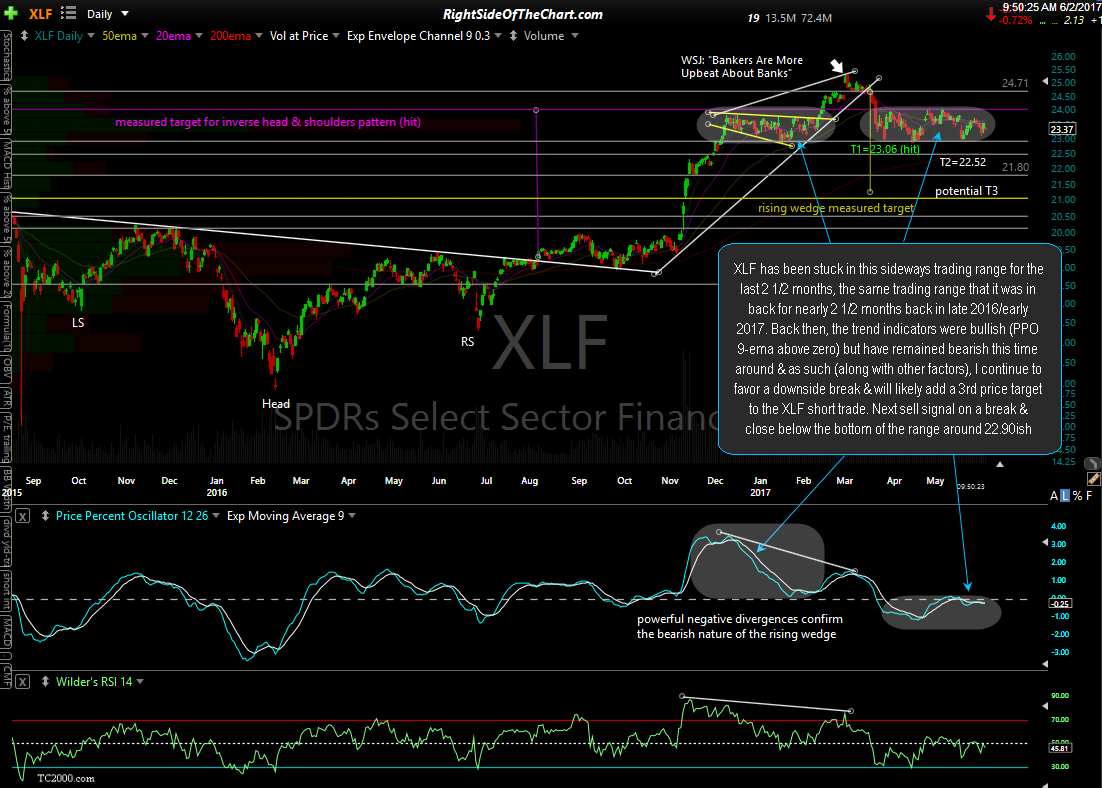
After hitting the first price target for a quick, 2 trading session gain back in late March, the XLF (Financial Sector ETF) Active Short Trade has traded in a well-defined sideways trading range since. That 2½ month trading range happens to be the same trading range that it was in back for nearly 2 1/2 months back in late 2016/early 2017. Back then, the trend indicators were bullish (PPO 9-ema above zero) but have remained bearish this time around & as such (along with other factors), I continue to favor a downside break & will likely add a 3rd price target to the XLF short trade. Next sell signal on a break & close below the bottom of the range around the 22.90 level.
My continued expectation for more downside in the financial sector also factors in the outlook for JPM (JP Morgan Chase), the largest US bank & the second largest component of XLF behind Berkshire Hathaway. Despite a resilient stock market that refuses to go down (or up, for that matter, with the S&P 500 trading today a mere 1.15% above where it was trading over 3 months ago), by nearly all metrics that I follow, the outlook for the financial sector & especially JPM remains bearish. Lots of bearish technical developments on JPM in recent months including a breakdown & backtest of a bearish rising wedge pattern with a divergent high in place; a breakdown below the primary uptrend line; intermediate trend indicator flipping from bullish to bearish back in late March & remaining so since as well as an impulsive breakdown below the neckline of a Head & Shoulders topping pattern on Wednesday of this week.
Chances are that the financials (XLF) will only break down below this trading range & move much lower only if the broad market reverses & so far, that certainly hasn’t been the case. Should the market continue much higher then chances are that XLF will ultimately break to the upside of this multi-month trading range which has been capped around the 24 level. The suggested stop for the XLF short trade remains any move above 24.25.
One last thing to mention would be the fact that should XLF make an impulsive break below the bottom of the trading range & JPM continues lower following the most recent breakdown, both have very thin trading zones just below which were the result of the post-election rally which very quickly carried the financial stocks higher. The bottom of that “thin zone” from the Trump Pump is about 15% below the bottom of the recent trading range. Thin zones, a lot like gaps, tend to be backfilled once entered & often fairly swiftly. Certainly something worth monitoring IMO.


