
JO (coffee ETN) is under consideration as both an official Long Swing Trade as well as a Long-term Trade (i.e.- Trend Trade) idea and will be added as a trade setup for both categories. There are a lot of similarities to the technical posture of coffee prices now and back in late 2013, just before coffee exploded on a nearly vertical 110% rally, the initial leg up in a 125% bull run that ended with the divergent high about a year later.
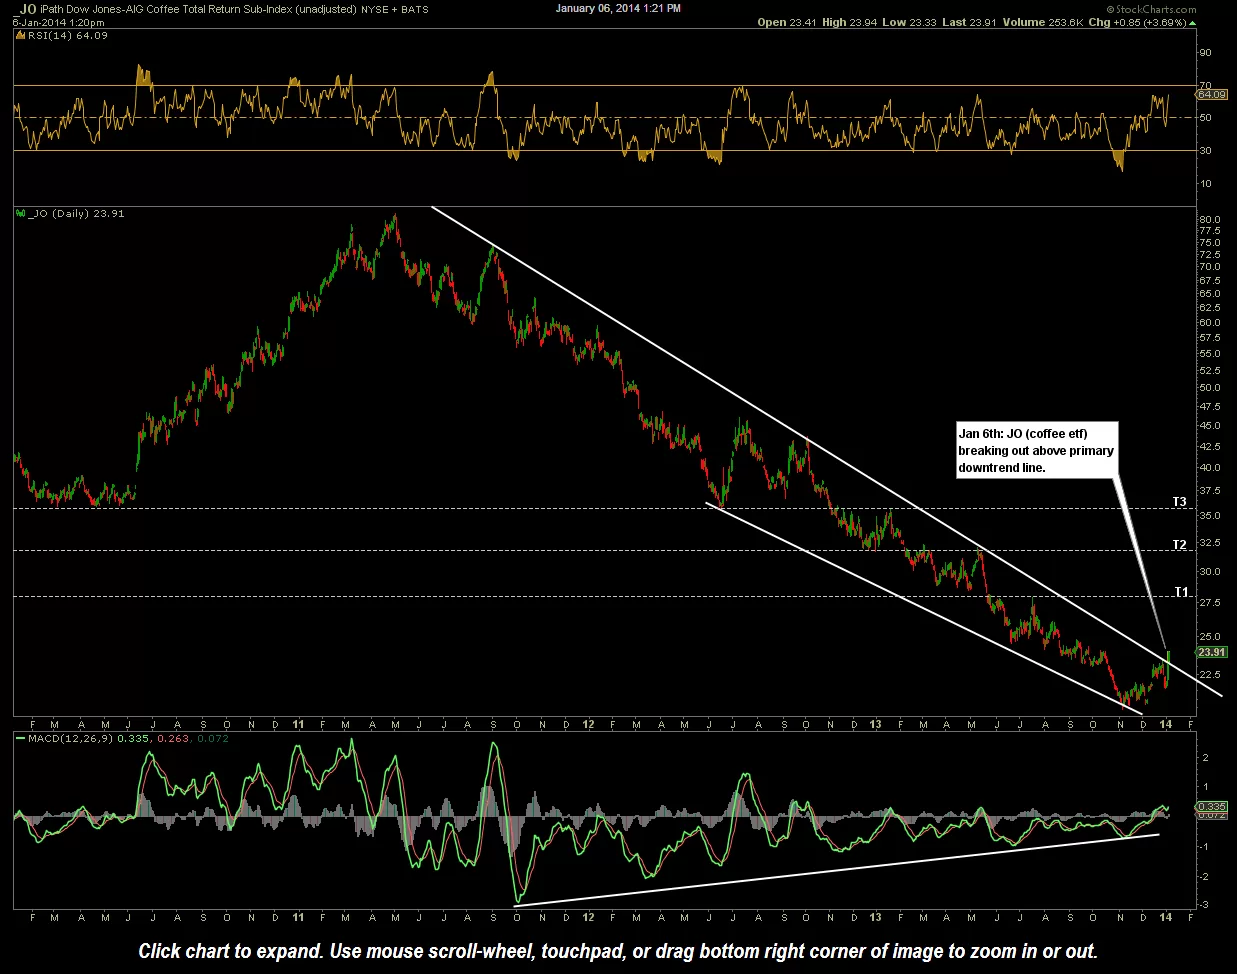
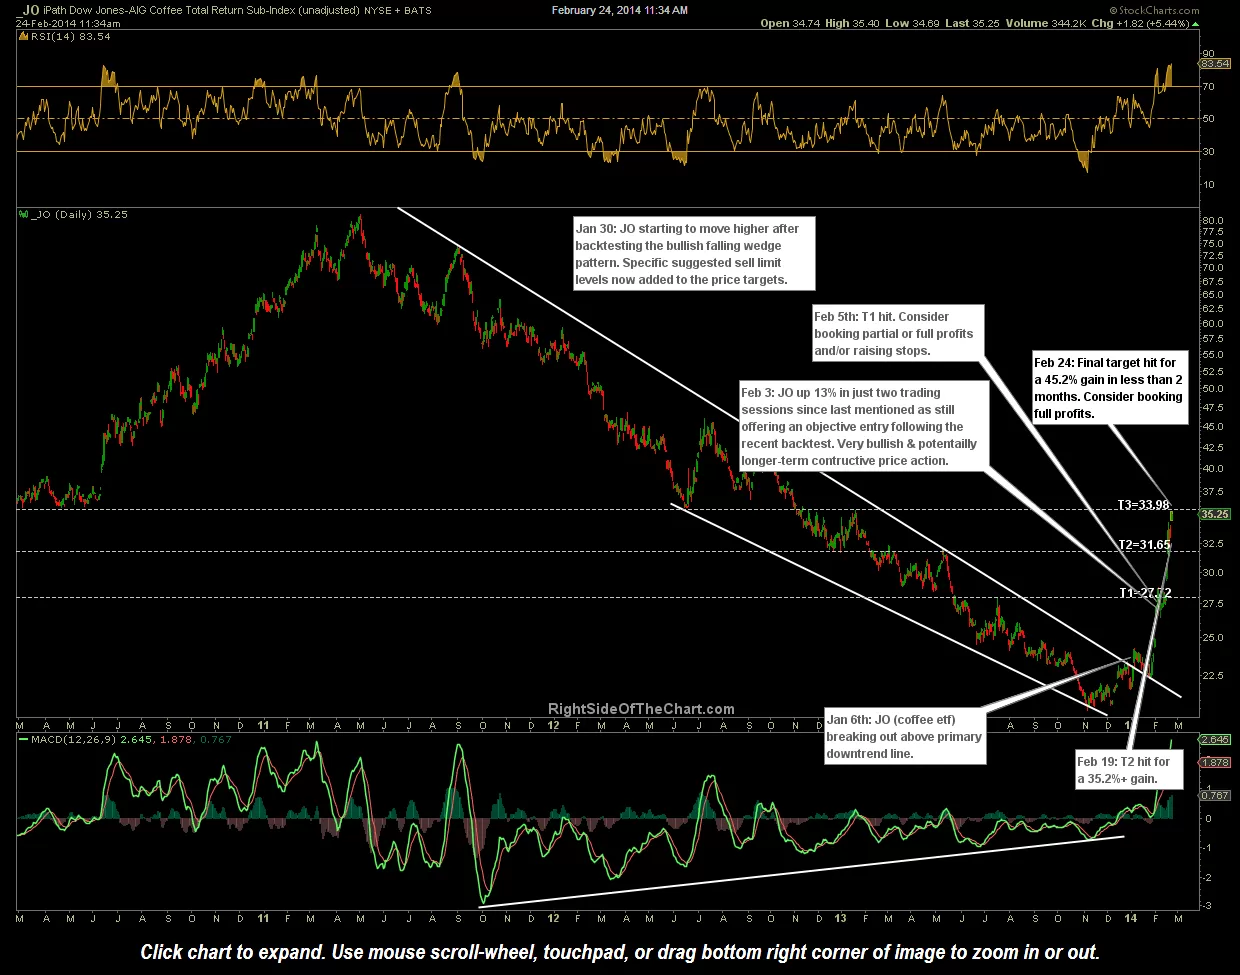
We were able to capture a good part of that initial bull run for a 64% profit using the “old JO” (more on that below*) with a very similar technical setup back then as we have today. JO was first added as an Active Long Trade in this post back on Nov 6, 2013 as $COFFEE (coffee futures) had fallen to the 1.00ish support level on the long-term weekly chart along with positive divergences (just they have now) with prices setting up in a bullish falling wedge pattern on the 60-minute charts (as they now have). The 64% gain back then was a string of two official long swing trades spliced together with the first trade entered on Nov 6, 2013 hit for a quick 10.7% gain on Dec 19th (and reiterated as still bullish & still a hold as a Long-term Trade) and the recycling back into this second swing trade on Jan 6, 2014 when JO broke out above a primary downtrend on the more significant daily time frame, closing the swing trade out for a 45% gain & the long-term trade out for a 64% gain about 6 weeks later, just before the first sharp correction and not too far off where coffee prices topped later that year. The charts from those previous trades can be viewed below for comparision to today’s charts located further down the page. click on first chart to expand, then click on right edge of each chart to advance.
-
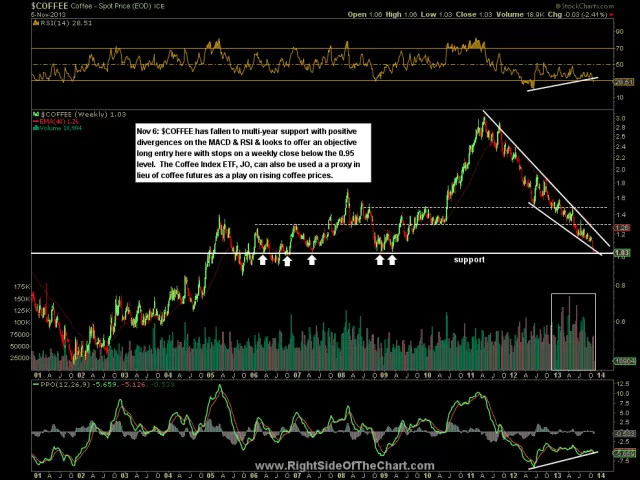
- $COFFEE weekly- Nov 6th

-
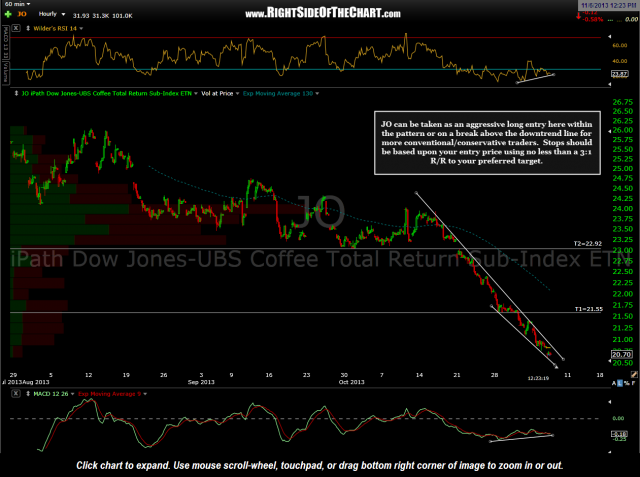
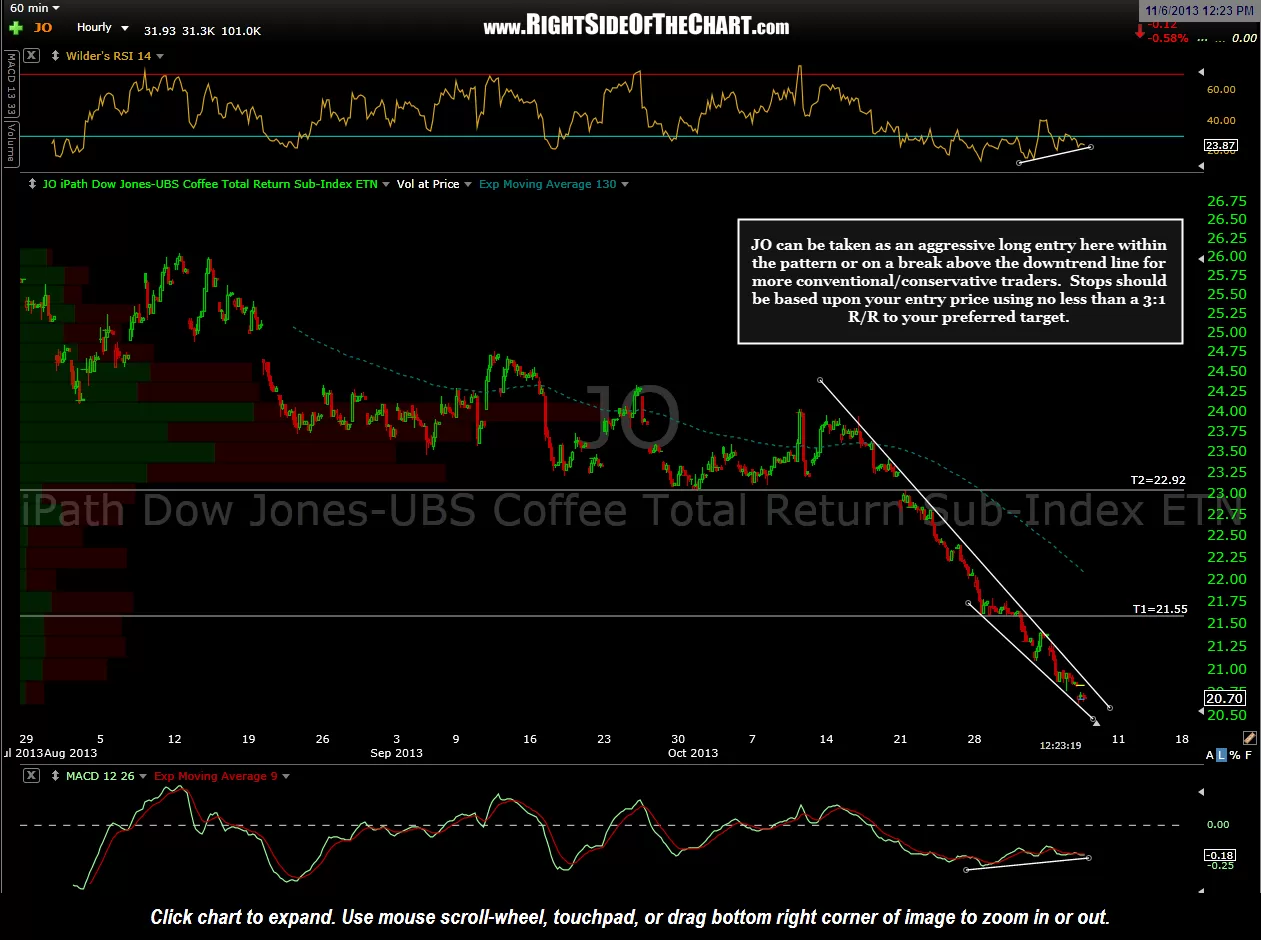
- JO 60 minute- Nov 6th
-
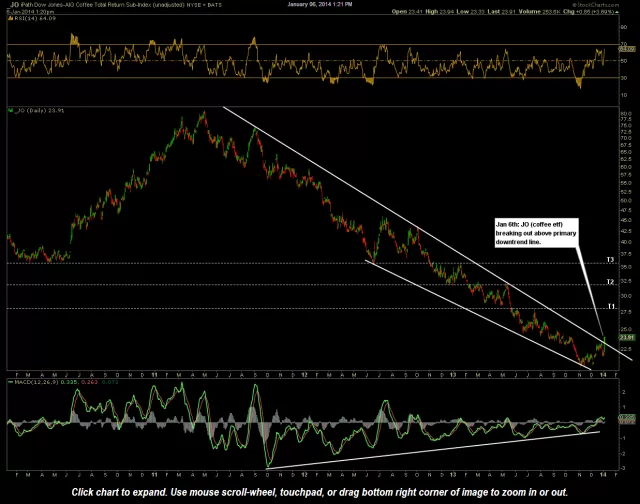
- JO- Coffee ETF daily chart
-
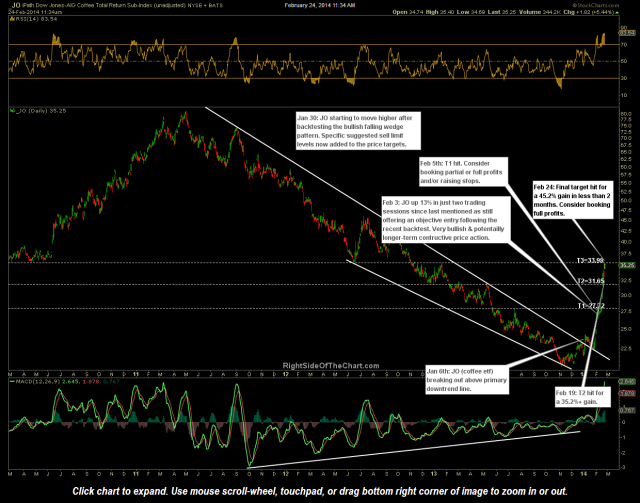
- JO daily Feb 24th- Final Target Hit
Of course, history doesn’t always repeat, at least not exactly the same when it comes to technical analysis and as with back then, there are absolutely no guarantees that the 1.00ish support level will hold or that coffee will immediately embark on a strong bull run if it does (i.e. coffee could base around the 1.00 level for months or even a year or more)… and that is what stops are for. With that being said, I’ve traded coffee for many years and as a quick glance at the 20-year weekly chart will confirm, coffee prices don’t like to stay idle very long with coffee usually either trading in a pretty clear & strong bull or bear trend.
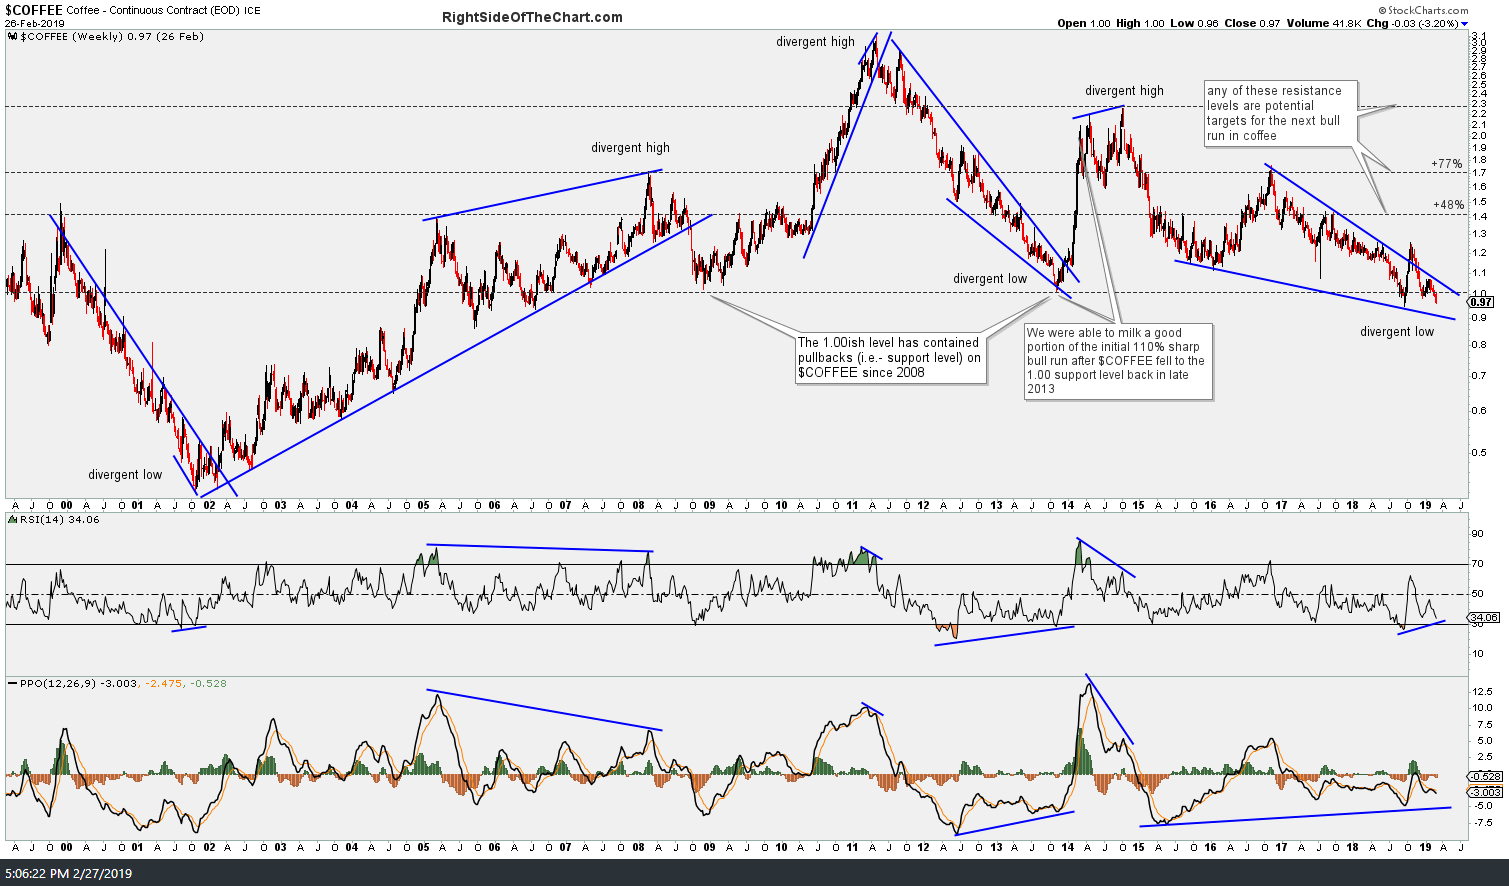
$COFFEE 20-yr weekly Feb 27th
Trade Parameters:
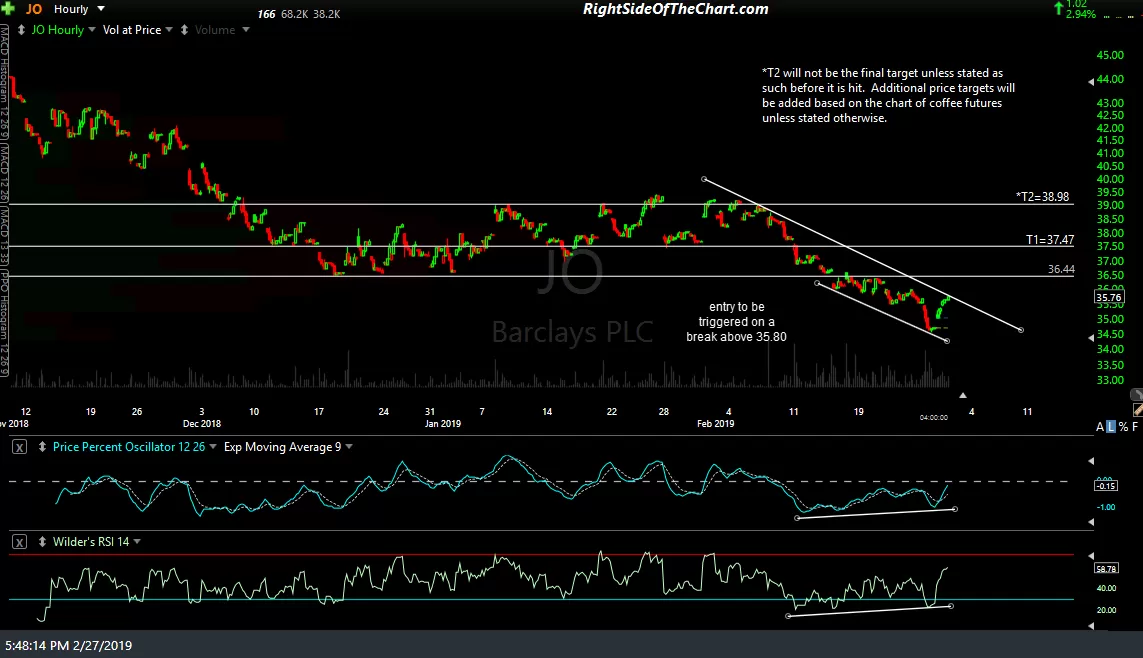
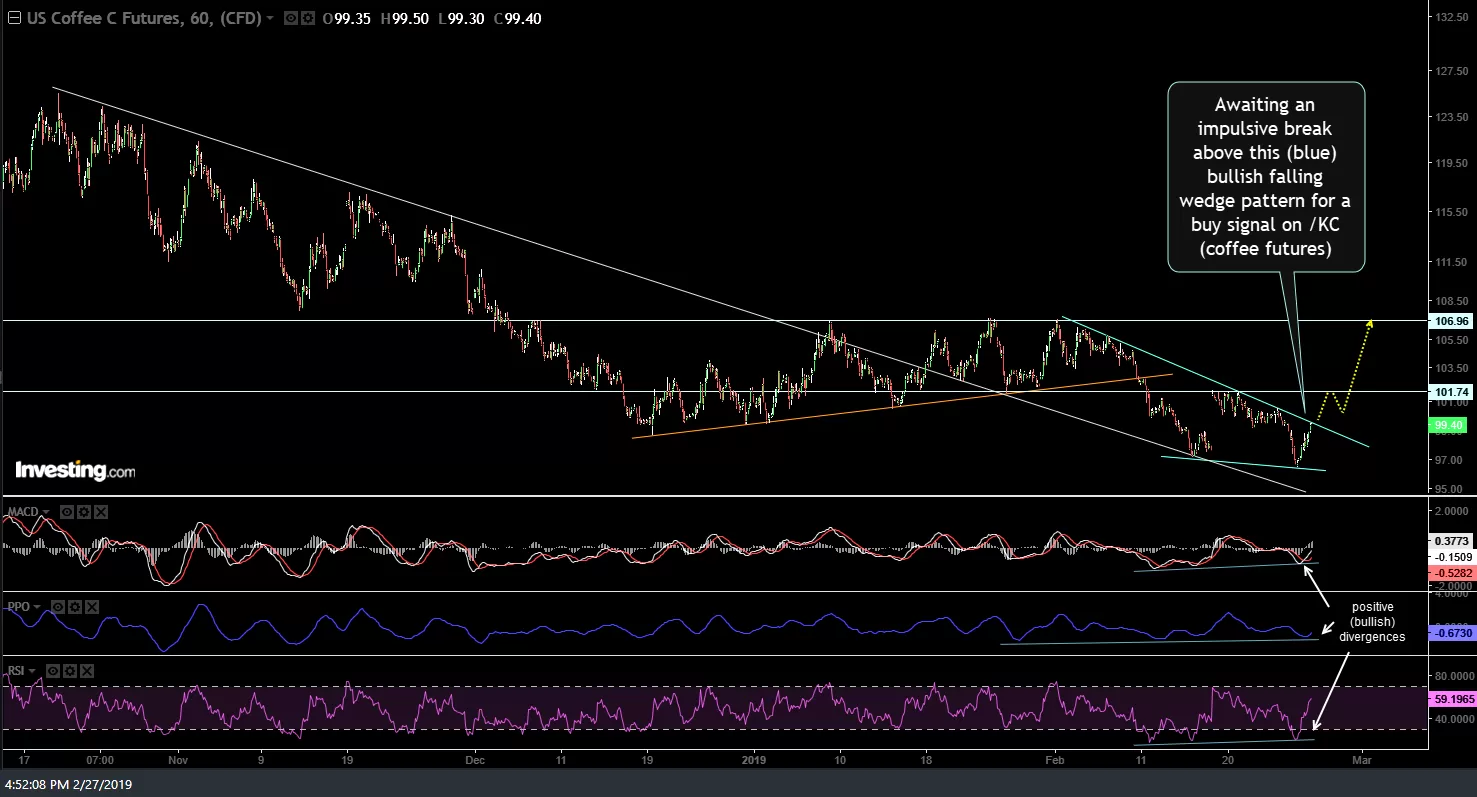
After the 60-minute chart of /KC (coffee futures) was posted before the market opened today, it rallied throughout the day to close the session right on the minor downtrend line/underside of the bullish falling wedge pattern.JO (coffee ETN), which will be the official proxy for this trade, has a similar downtrend line on the 60-minute chart which it also closed at today. While an imminent breakout appears likely, resistance is resistance until & unless taken out. As such, JO will trigger a long entry on a break 4 cents above today’s high of 35.76 (i.e.- entry triggered on a break above 35.80 or any print of 35.81 or above).
-
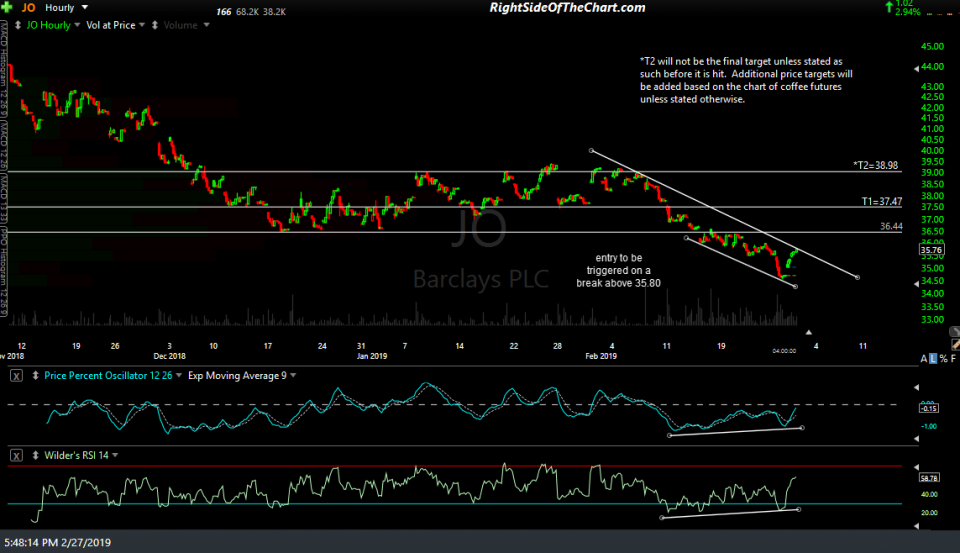
- JO 60-min Feb 27th
-

- KC 60-min 2 Feb 27th
JO has a minor resistance level around 36.44 which is likely to produce a minor reaction but the first two price targets on this trade will be T1 at 37.47 & T2 at 38.89 with at least one additional price target to be added unless stated otherwise in advance of T2 being hit. While there will likely be one or more additional targets added, the maximum suggested stop for this trade will be a daily close below 33.60. However, those only targeting T1 or T2 might consider a stop below the recent low of 34.55 or above. The suggested beta-adjusted position size for this trade is 0.80. (click here to try our new position size calculator)
*The “old JO” from that previous trade & several other trades on RSOTC over the years was replaced by JJOFF, which has since been replaced by the “new JO” by the ETN provider, Barclay’s iPath series of ETNs.