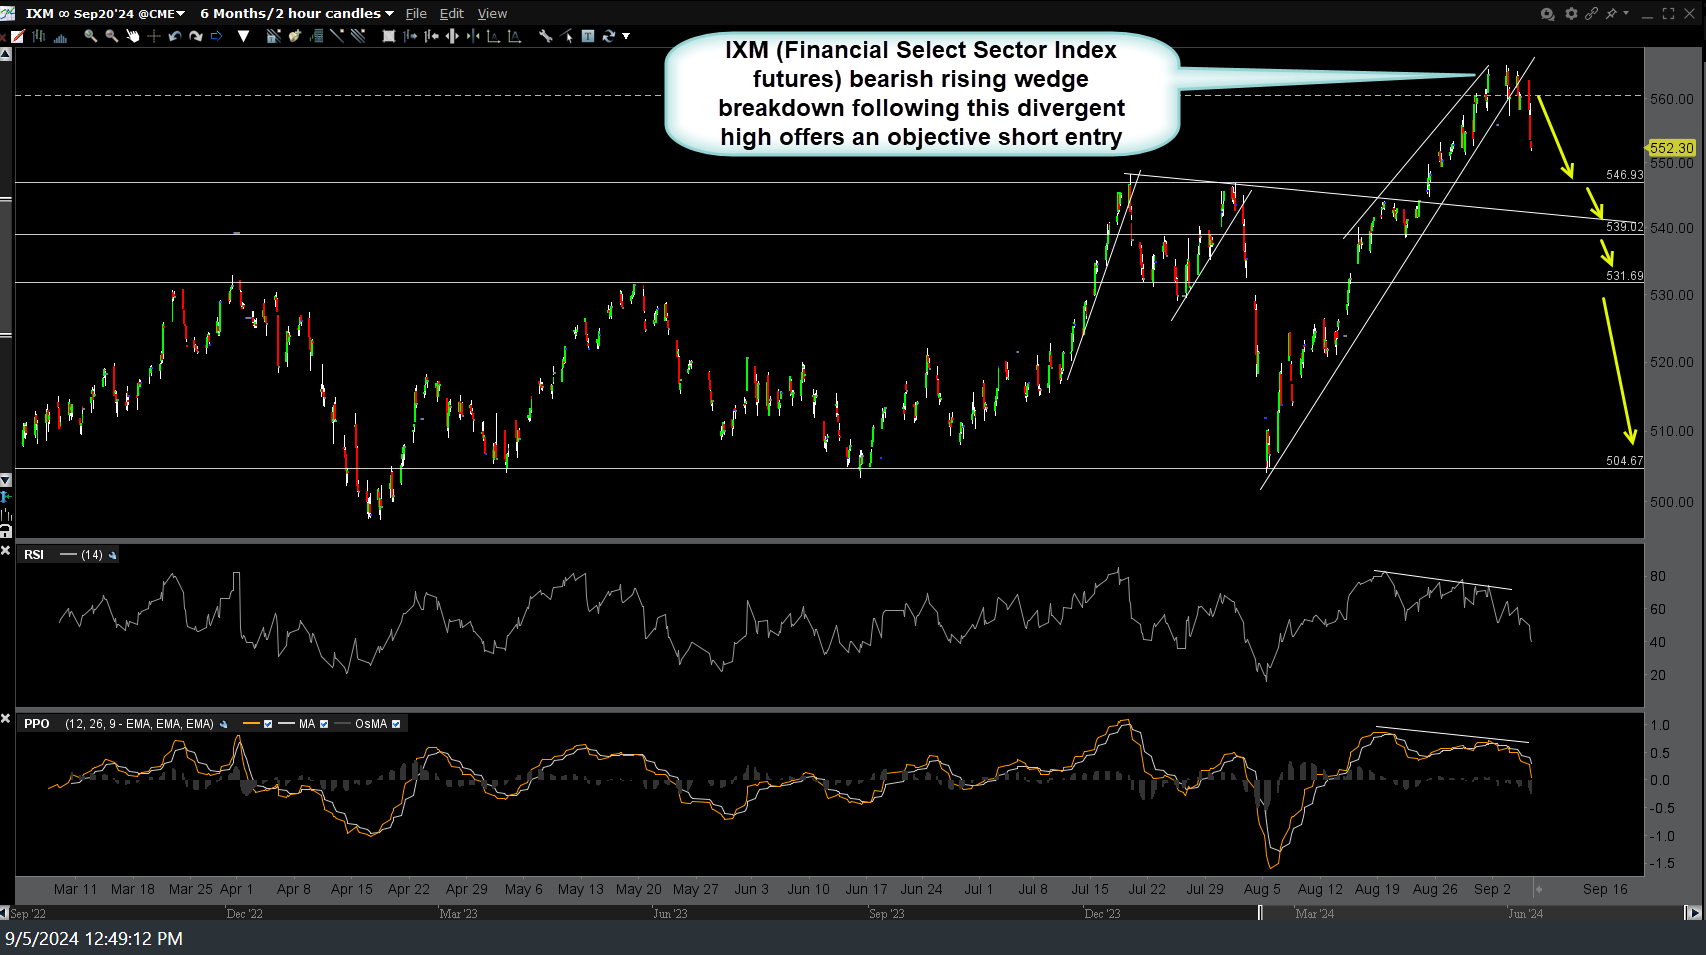
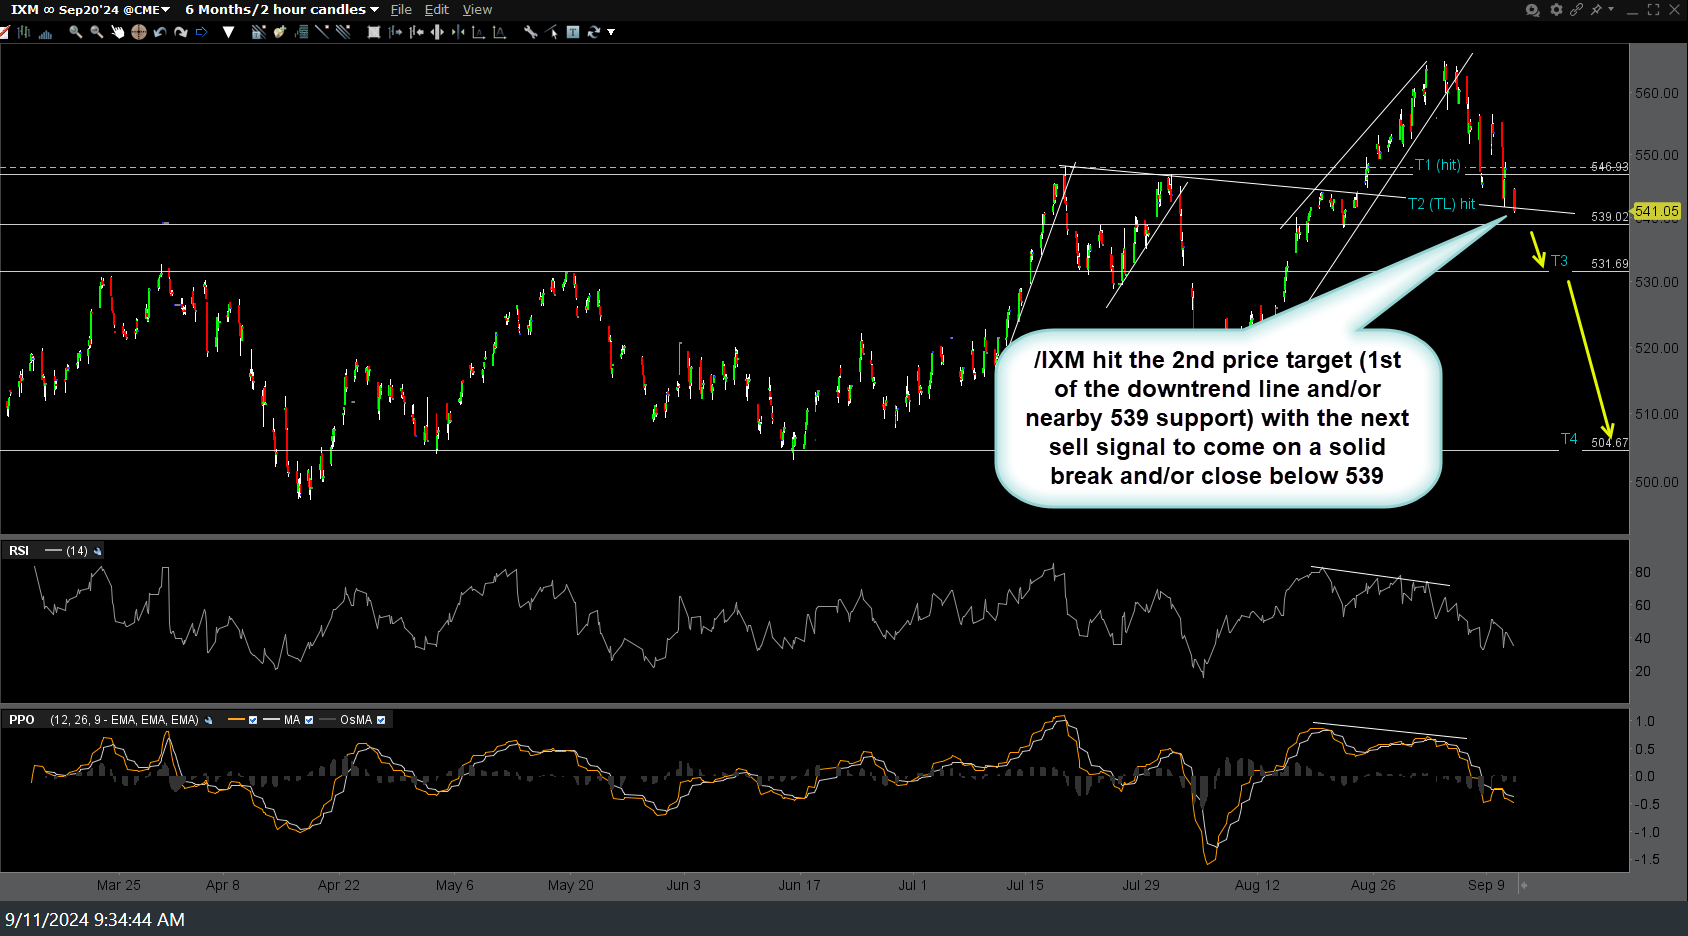
/IXM (financial sector futures) hit the 2nd price target (1st of the downtrend line and/or nearby 539 support) with the next sell signal to come on a solid break and/or close below 539. Previous (last Thursday’s) and updated 120-minute charts below.
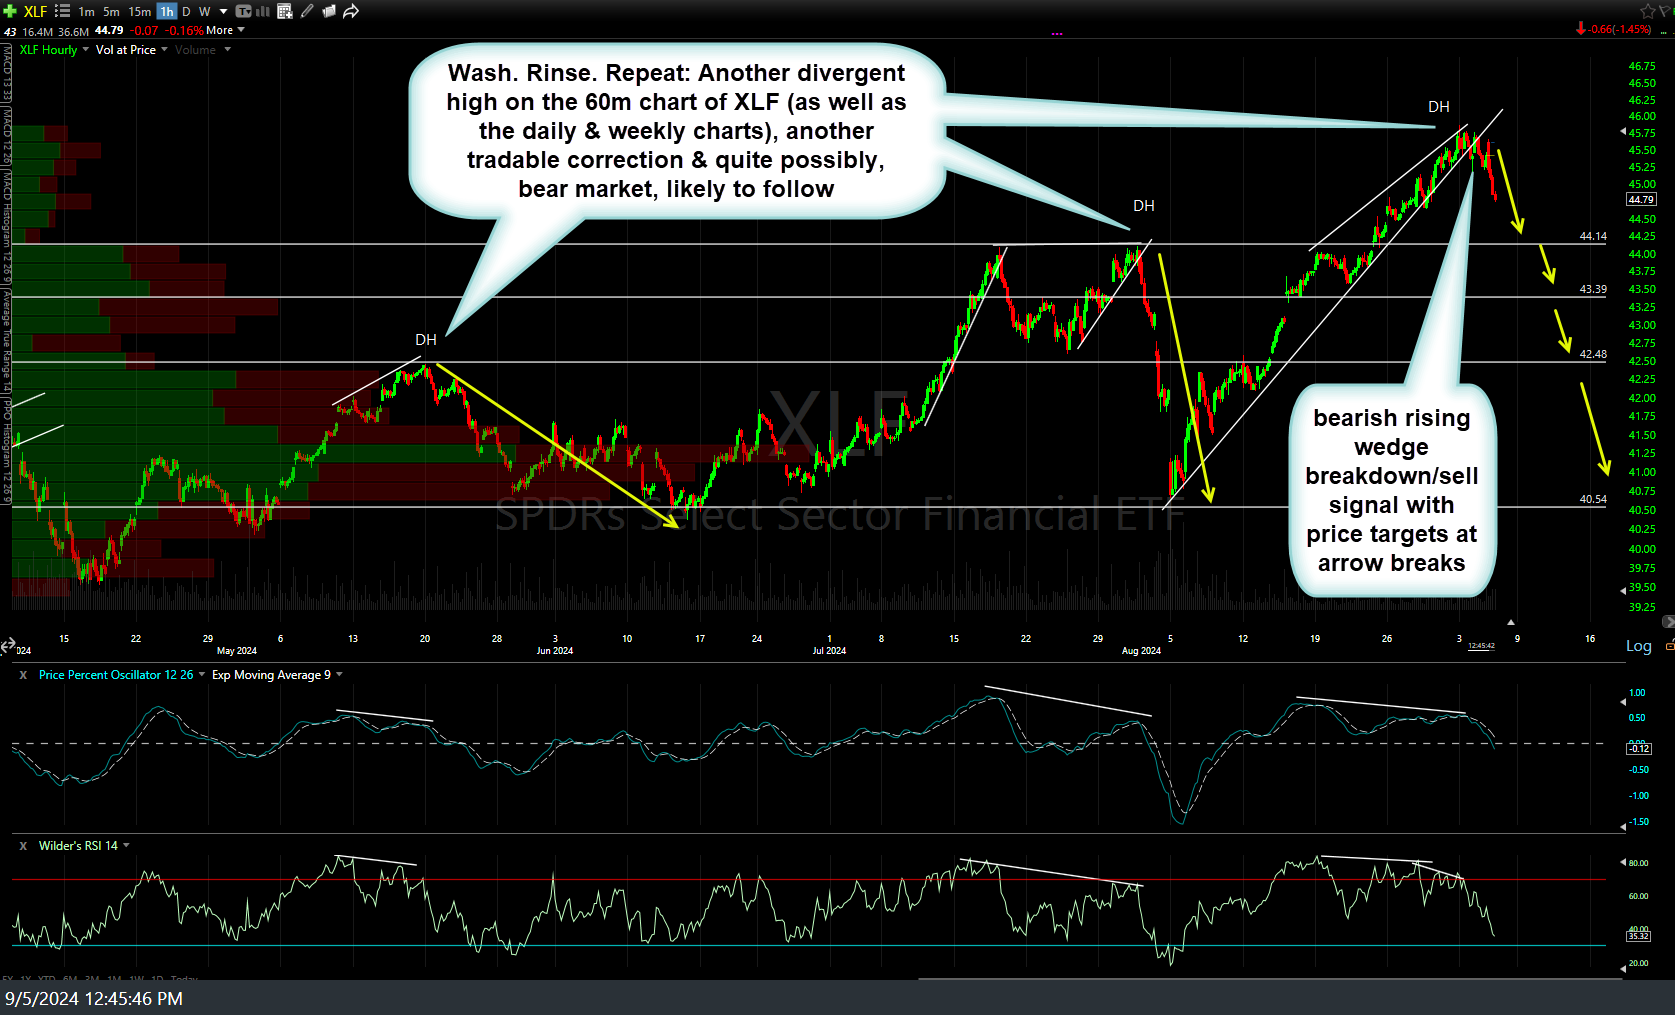
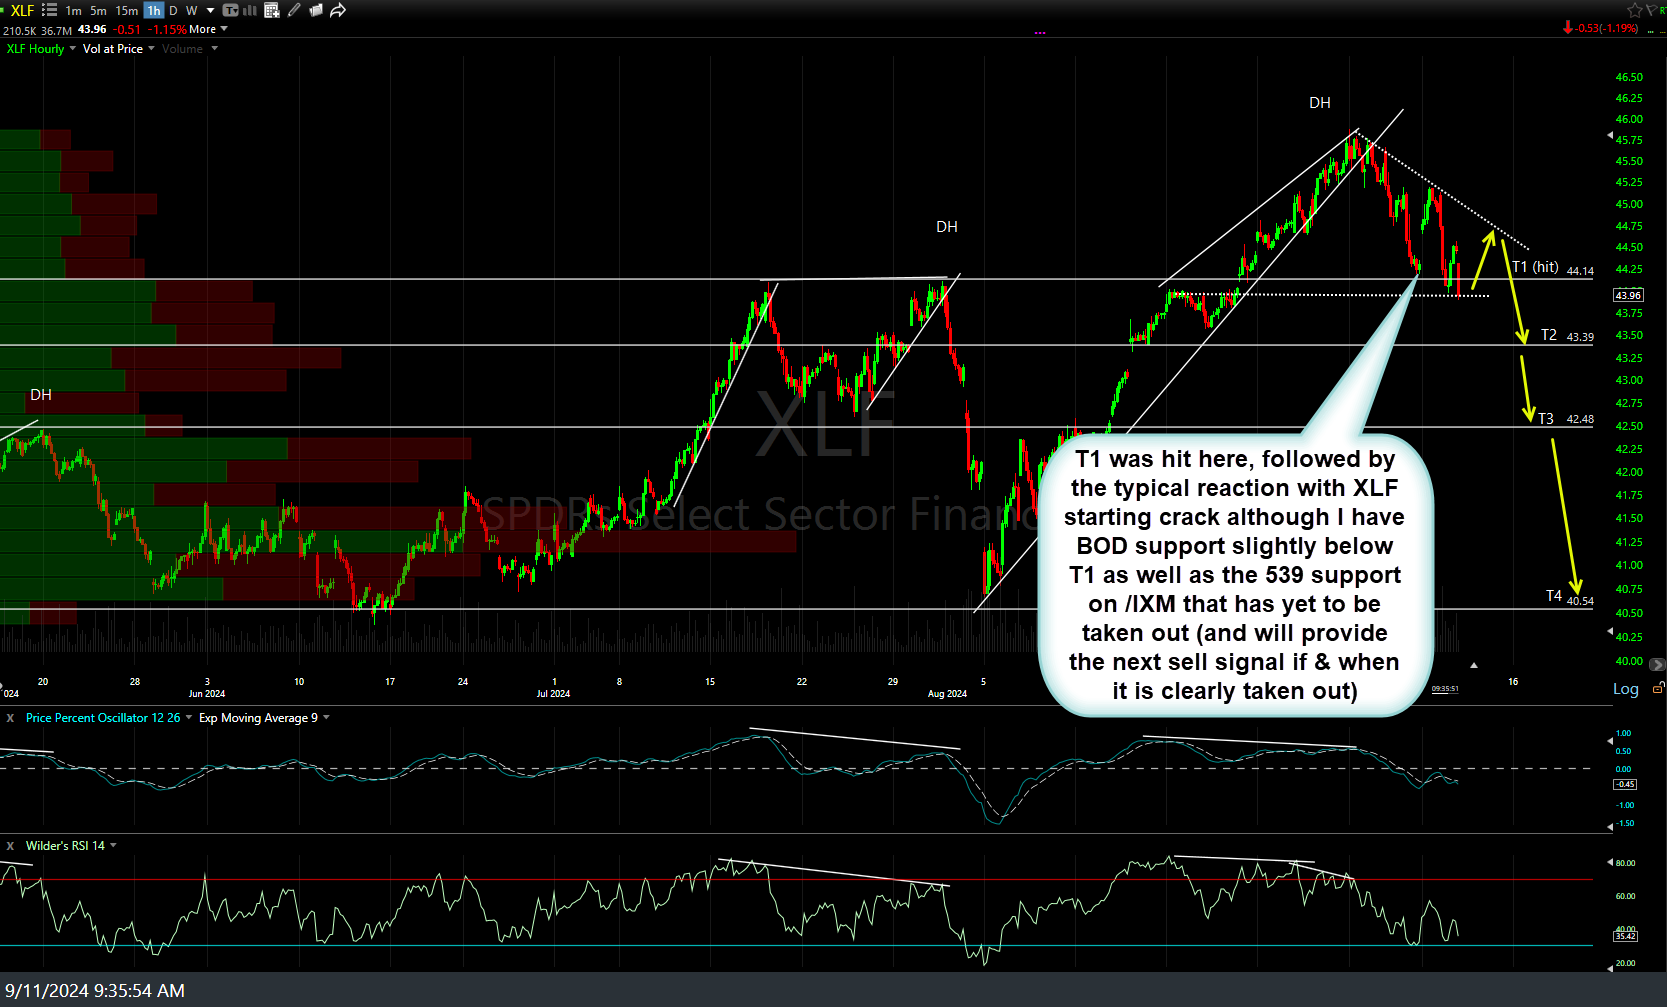
Likewise, XLF (financial sector ETF) hit the first price target on Friday, followed by the typical reaction with XLF starting crack below that key support now although I have BOD support slightly below T1 as well as the 539 support on /IXM that has yet to be taken out (and will provide the next sell signal if & when it is clearly taken out). Previous (Thursday) & updated 60-minute charts below.


