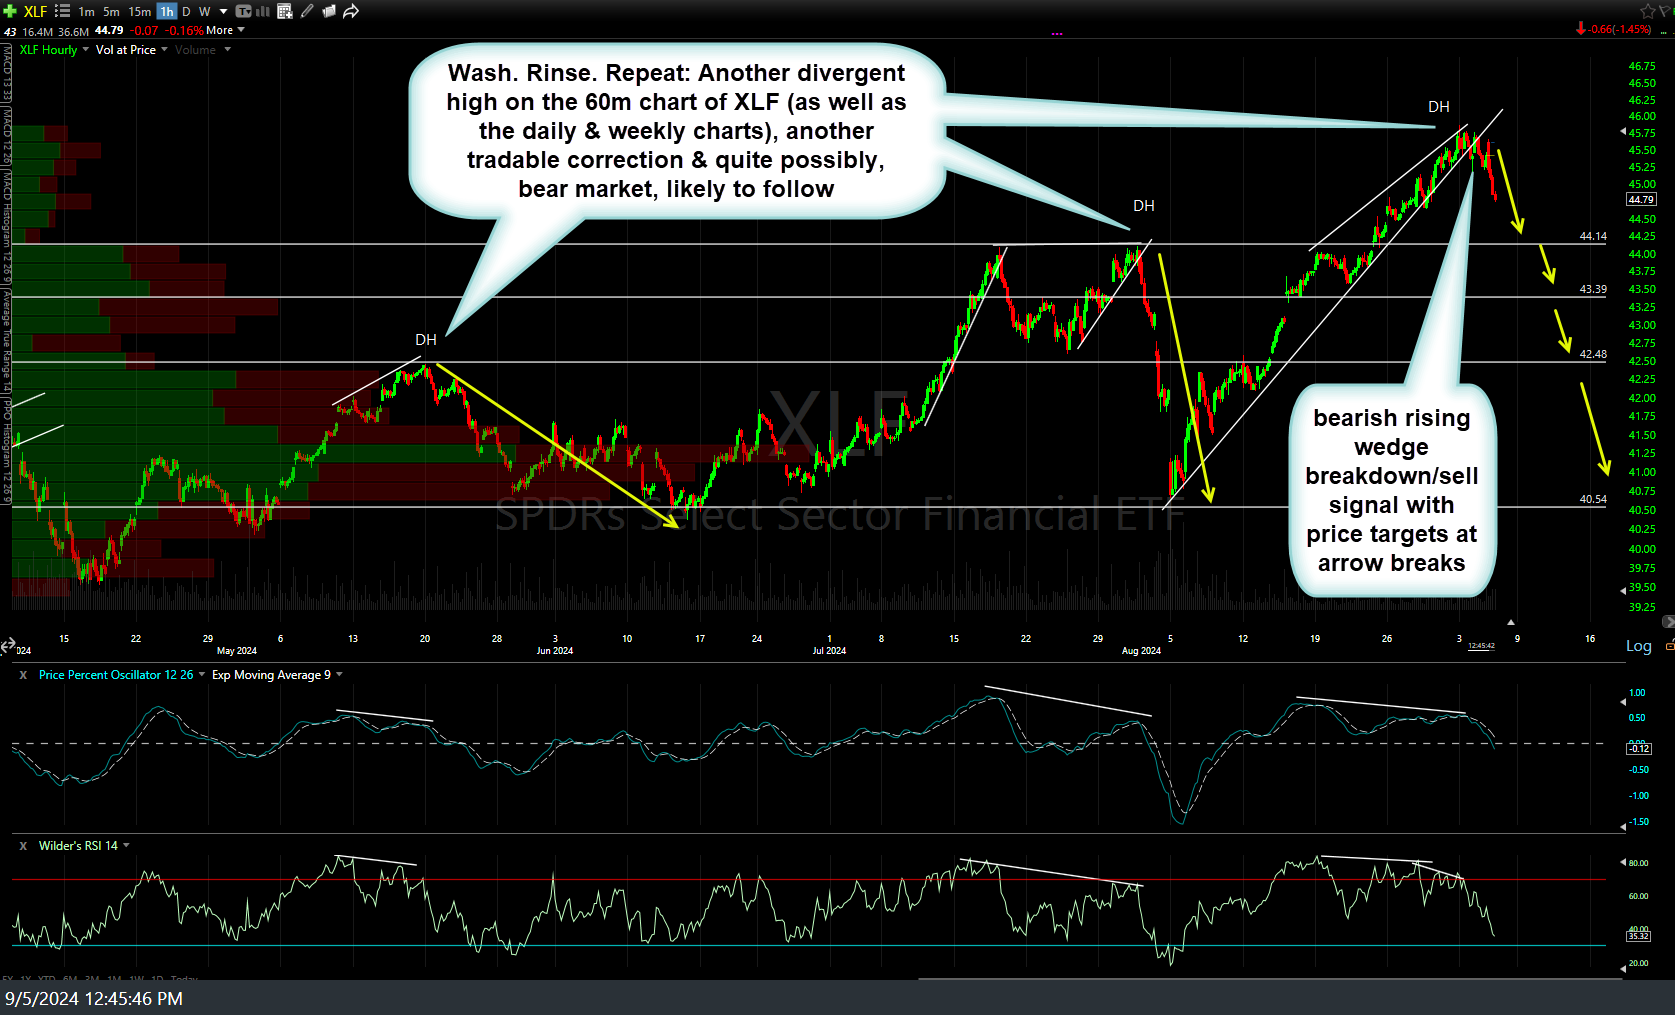
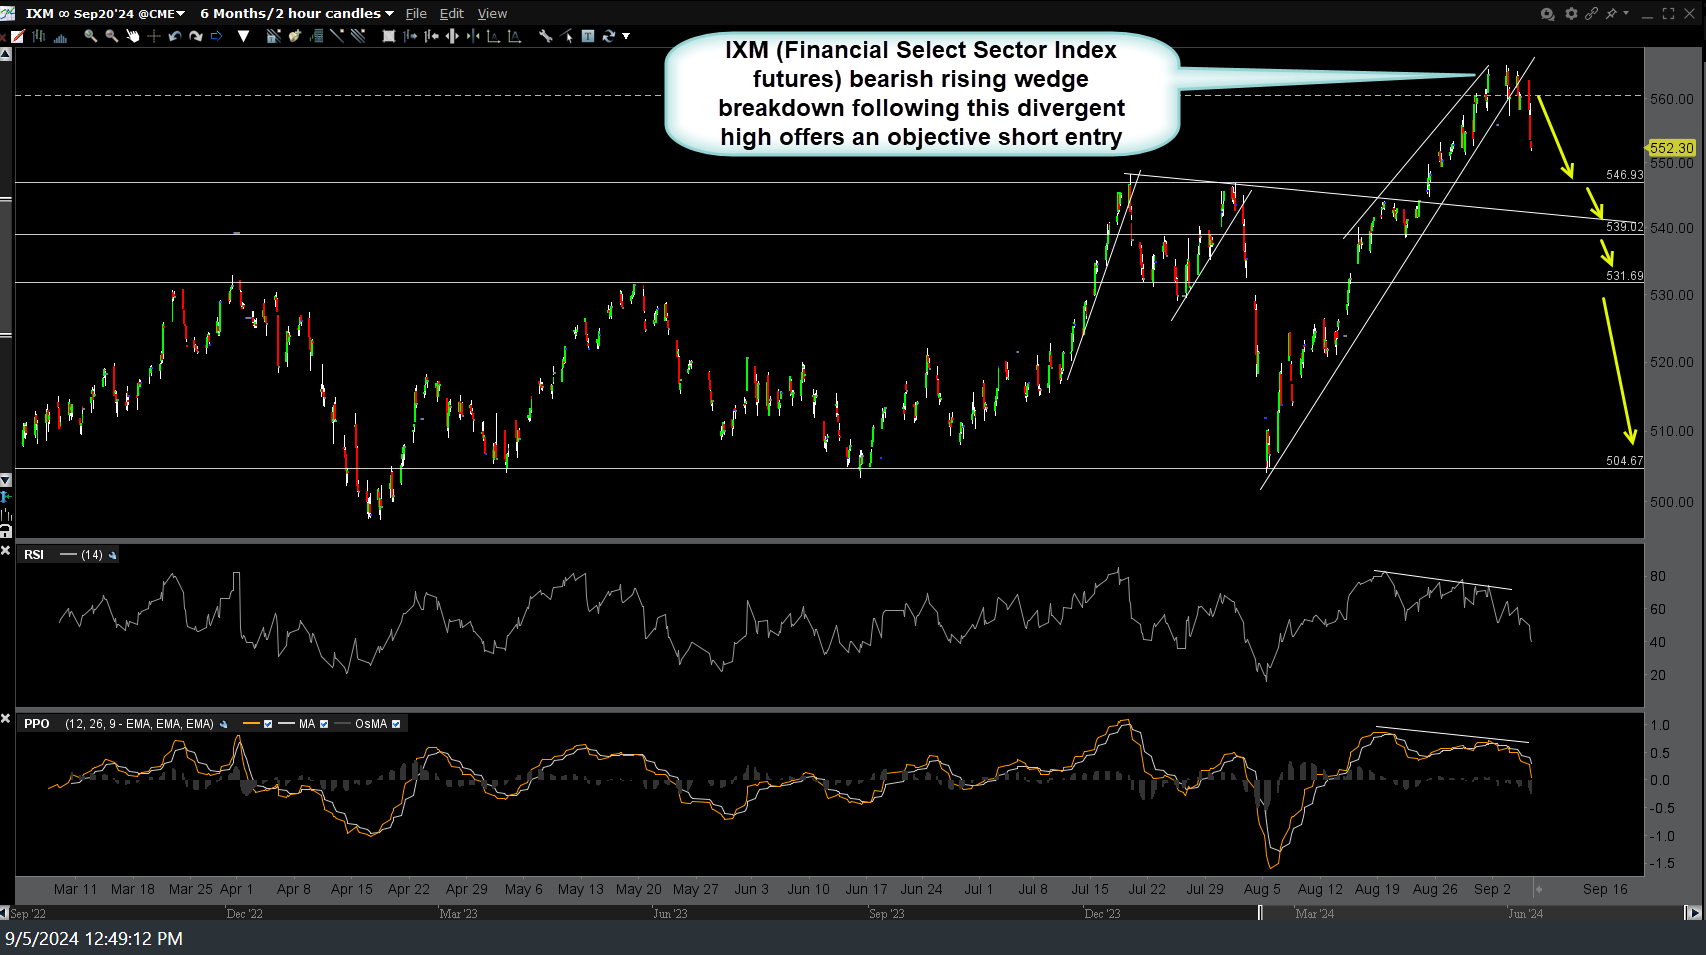
Following the recently highlighted sell signals & objective short entry on the financial sector & several key stocks such as JPM (JP Morgan Chase & Co.), I’ve included some near-term price targets on the 60-minute chart of XLF (financial sector ETF) & the 120-minute chart of /IXM (financial sector futures contract) below.
As stated in the video published earlier today, in light of the recent sell signals & bearish technical posture/outlook for the financial sector, I now suspect that the S&P 500 will start to close the gap on the tech-heavy & financial light (or lacking) Nasdaq 100 Index, which significantly outperformed to the downside, falling over 60% more than $SPX into the recent August 5th lows.
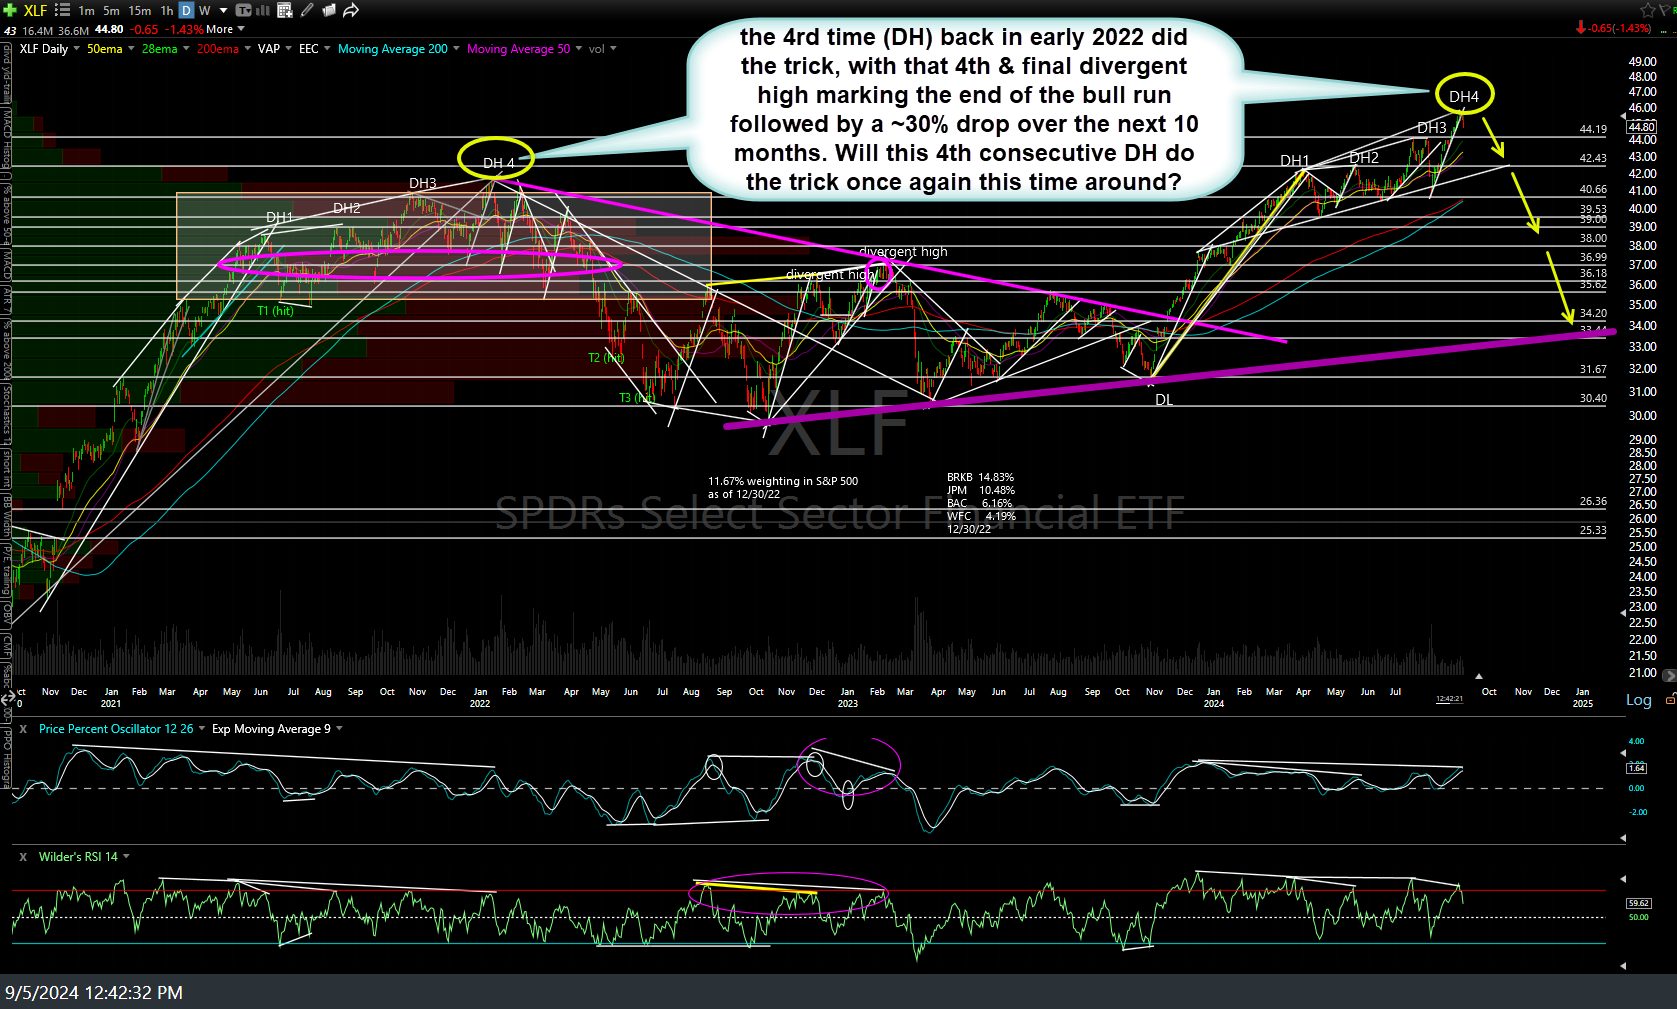
As the daily chart below illustrates, back in late 2021/early 2022, XLF put in a series of four consecutive divergent highs, each followed by a relatively minor correction but with each successive divergent high simply an extension of a much larger, single divergent high culminating from the original DH, with that fourth & final DH marking the end of the bull run in the financial sector, followed by a ~30% drop over the next 10 months.
That ~30% drop ended with the (positive/bullish) divergent low on Oct 13, 2022 along with bottoms (and divergent lows) in the major stock indices, which proved to the be the technical catalyst for the rally that appears to have taken XLF full circle as it just put in its fourth consecutive divergent high (and one much larger single DH, which also shows well on the weekly chart). History doesn’t always repeat… but it often rhymes.
FYI- Alternatives to shorting XLF, /IXM, or any of the individual financial stocks with the most bearish charts highlighted in recent videos, SKF is the 2x short financial sector ETF & FAZ is the 3x financial bearish ETF.


