
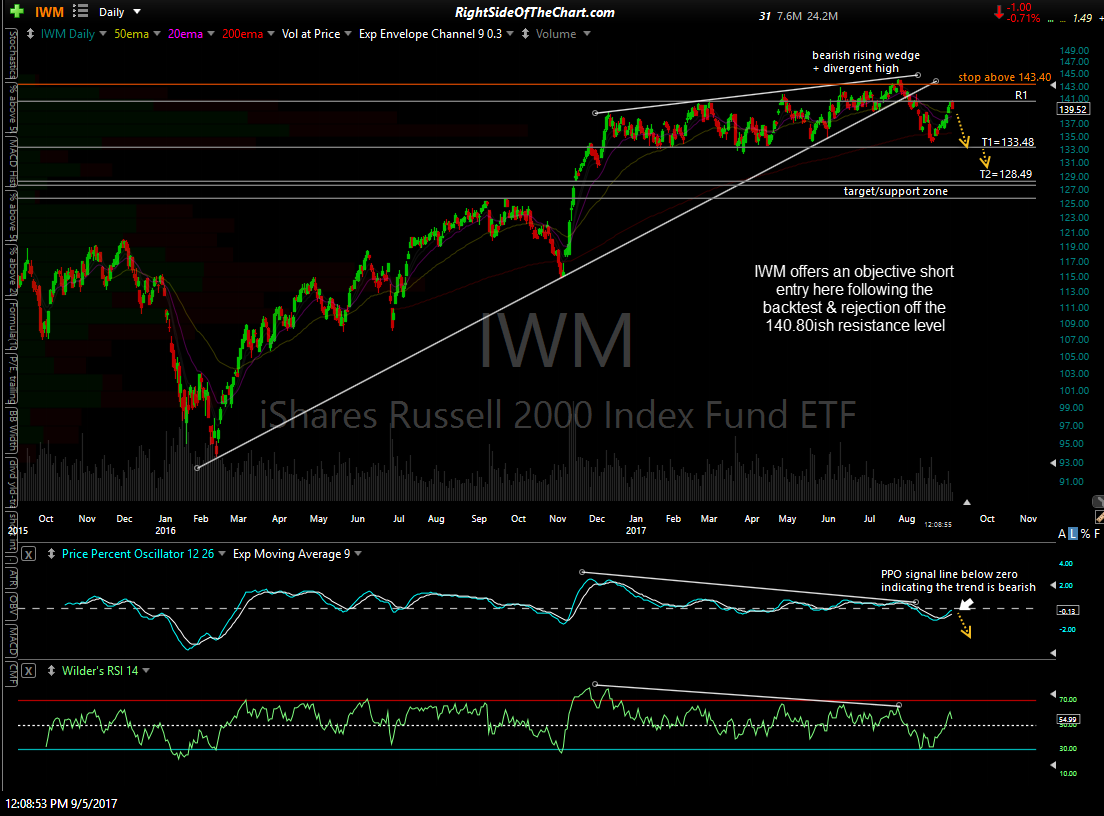
IWM (Russell 2000 Index tracking ETF) offers an objective short entry here following the backtest & rejection off the 140.80ish resistance level & will be added as an official short swing trade. The price targets are T1 at 133.48 & T2 at 128.49 with a suggested stop on any move above 143.40. The suggested beta adjustment for this trade is 1.0.
IWM daily Sept 5th
As shown in the daily chart above, IWM broke down below a large bearish rising wedge pattern, confirmed with negative divergence, back in early August. The small caps bounced off the bottom of their 9 month sideways trading range later that month, rallying form there to test the 140.80ish resistance level today, where IWM was rejected with an impulsive (and bearish engulfing) red candlestick so far today.
It’s been quite a while since I’ve added any of the broad market index tracking ETFs as official trade ideas and while my preference remains trading the most bullish & bearish individual stocks & sectors at this time, I’ve had numerous inquires as to when the next official trade on any of the broad market tracking ETFs would be. Some traders prefer trading the broad indices over individual stocks or sectors whether it is for the liquidity, the relatively safety from a large overnight gap due to an earnings report or news that could impact a particular company or sector, the amount of leverage provided from index futures or leveraged ETFs or any/all of the above.