
Should the bullish divergences on IWM (small-cap ETF) and /RTY (small-cap futures) as well those on some of the market-leading FAAMG stocks highlighted in the previous video play out for a rally, I’ve listed some potential price targets on the 60-minute chart of IWM & /RTY below. As an unofficial trade, these are the actual resistance levels where a reaction is likely, if hit, not the ‘adjusted’ price targets that are provided with official trades. As such, best to book profits just shy of your preferred target(s)/resistance level(s), should you decide to trade IWM, TNA (3x bullish small-cap ETF), or /RTY as either a pure-play long or as a hedge to existing swing short positions.
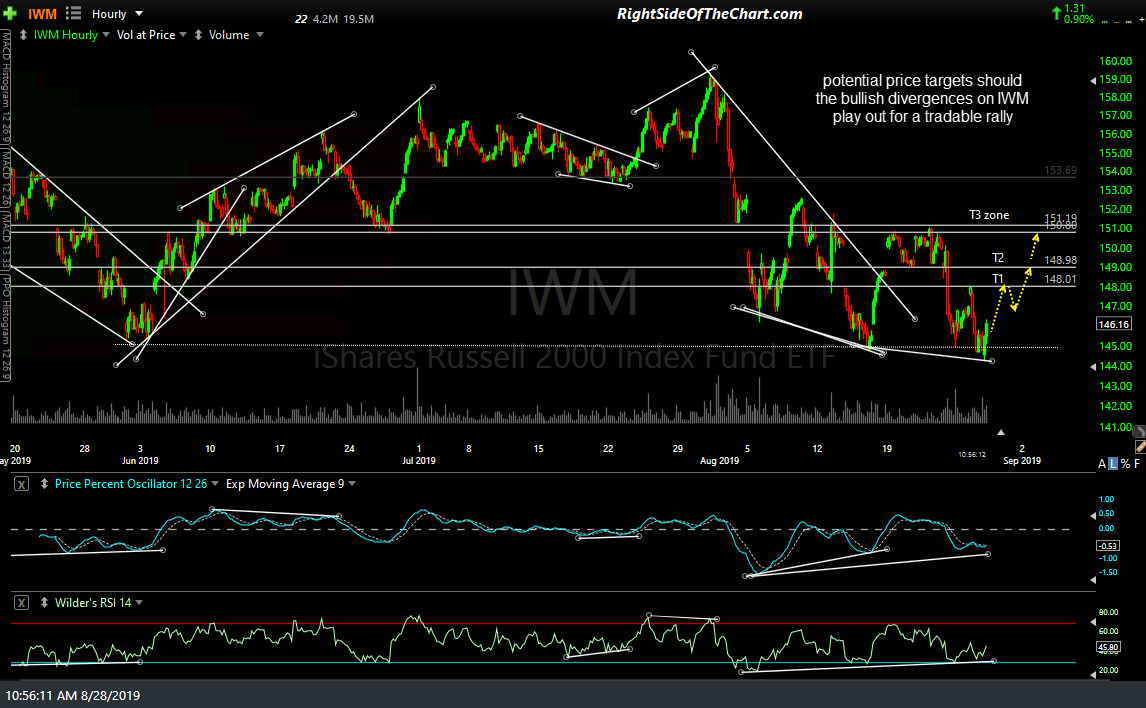
IWM 60-min Aug 28th
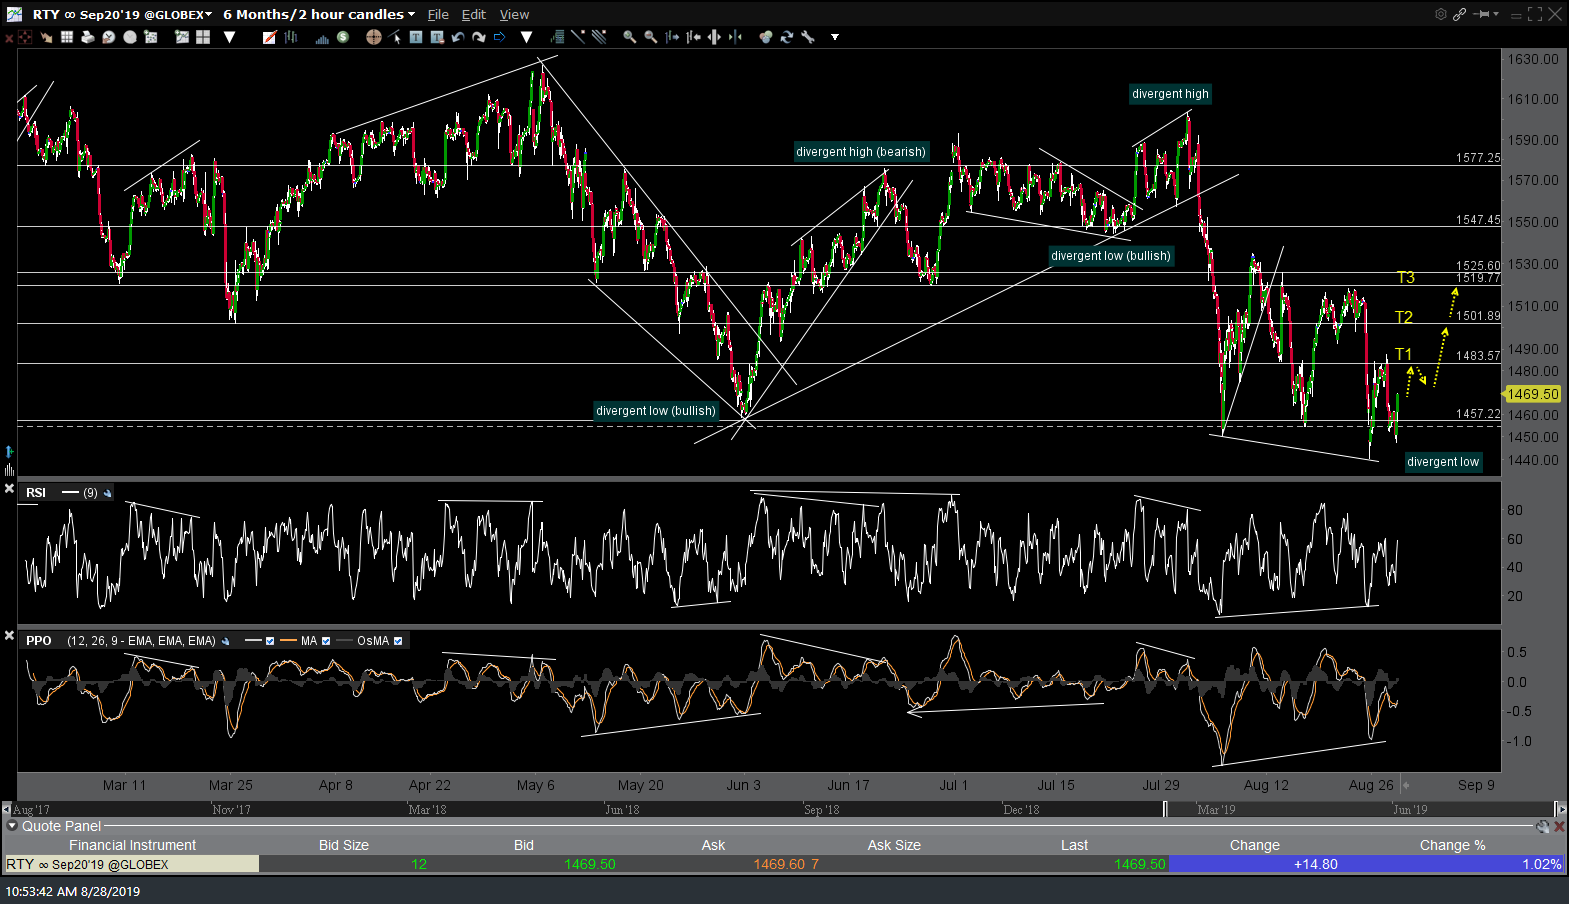
RTY 60-min Aug 28th
Also, keep in mind that the market is prone to sharp price swings & fake-outs (false breakouts) when locked within a trading range as it has been for nearly a month now. As such, sometimes you will see a nice looking long setup, such as this one, suddenly reverse & get sold into hard just as starts to appear to be playing out in a convincing manner. I’ve layered into several lots of /RTY so far today & will manually ratchet up my stops if & as the market rallies today while keeping a close eye on the large-cap indexes as well as the small-caps, ready to pull the plug on a moment’s notice if I see something that I don’t like as any rally in the small-caps will likely only go so far without the large-caps confirming.