
IWM (Russell 2000 Small-cap Index ETF) appears poised for a ~3.25% correction (from current levels) with a sell signal to come on a solid break and/or 60-minute close below this bearish rising wedge pattern (price target just above the 160 support level).
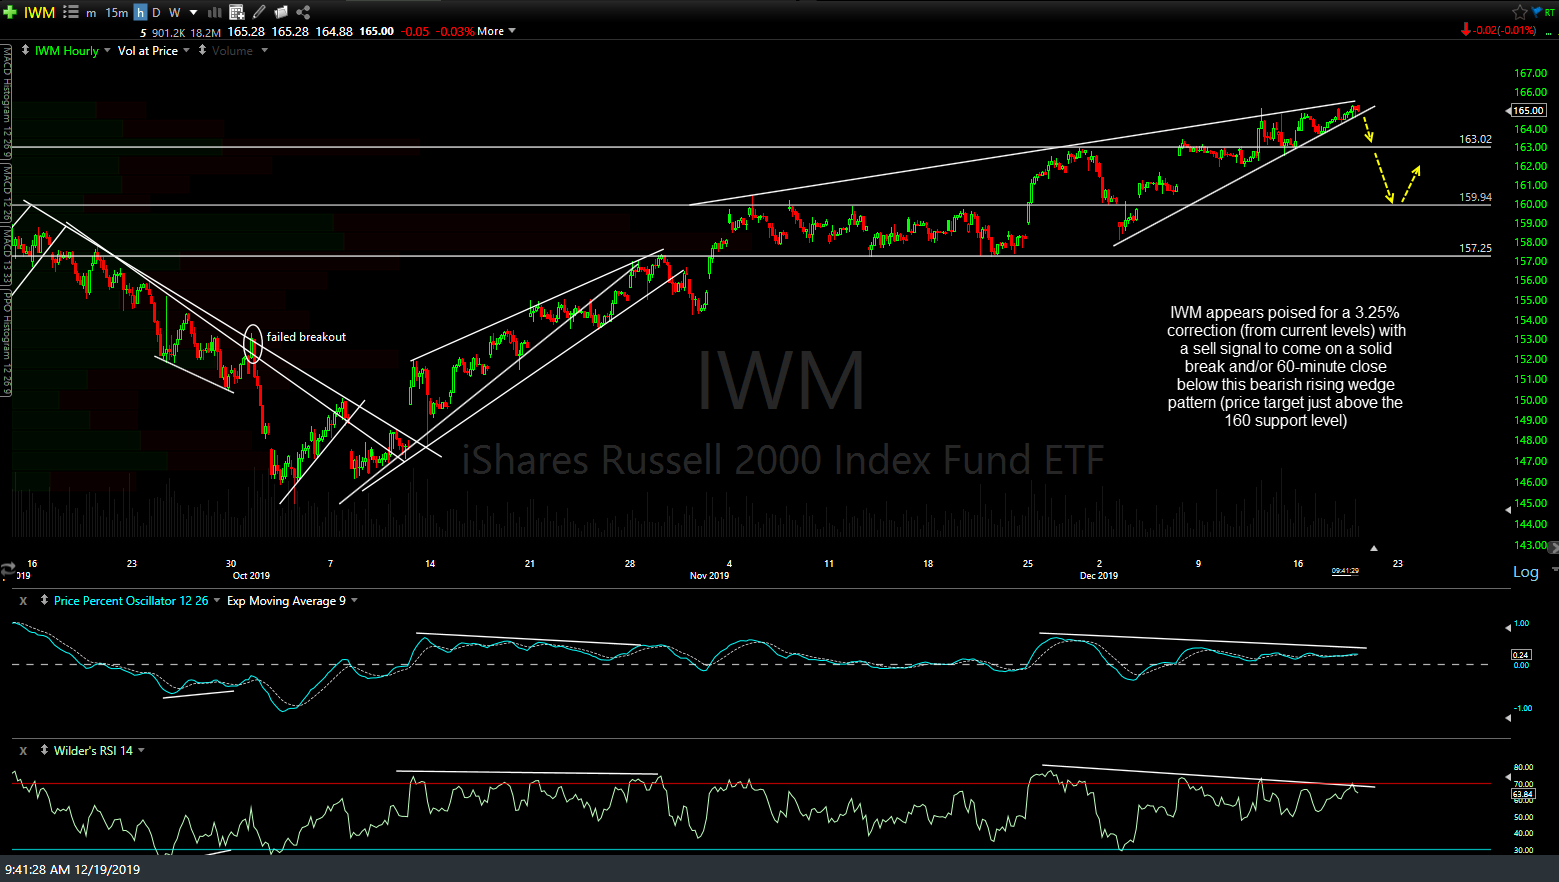
IWM 60m Dec 19th
However, the odds for this relatively quick & minor (as well as unofficial, due to the small gain potential) pullback trade on IWM playing out will be largely contingent on SPY & QQQ also breaking down below their respective 60-minute rising wedge patterns below.
-
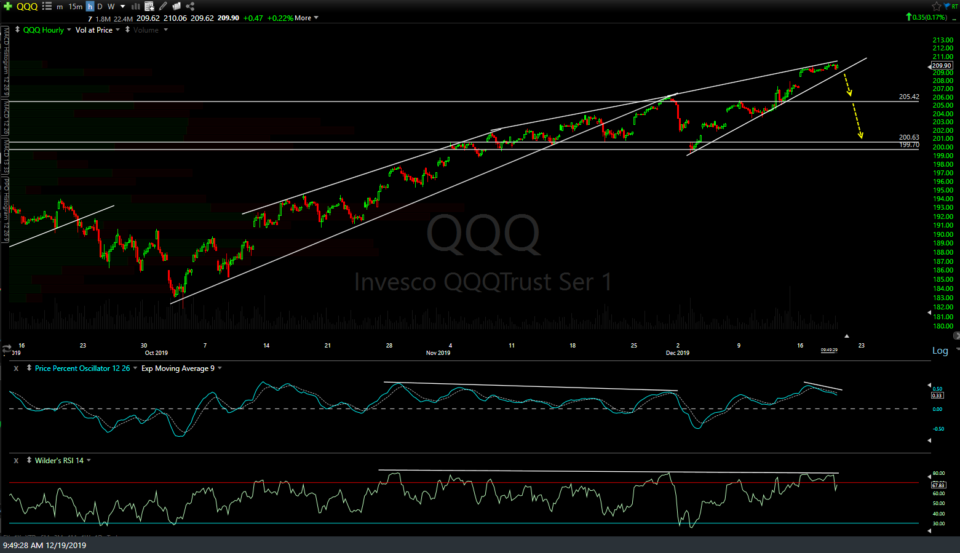
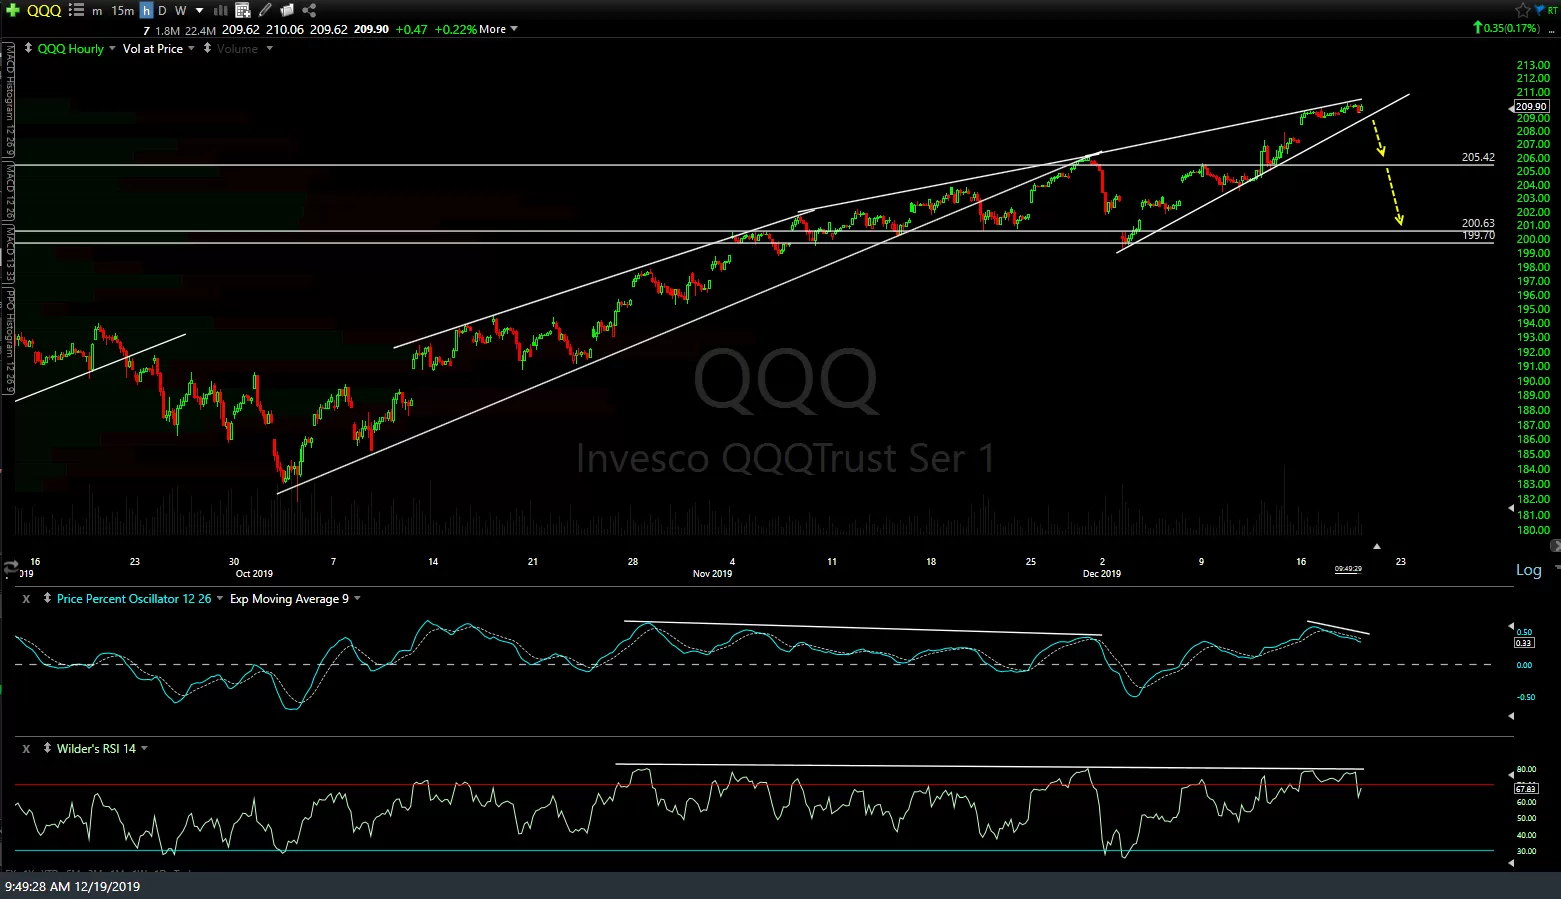
- QQQ 60m Dec 19th
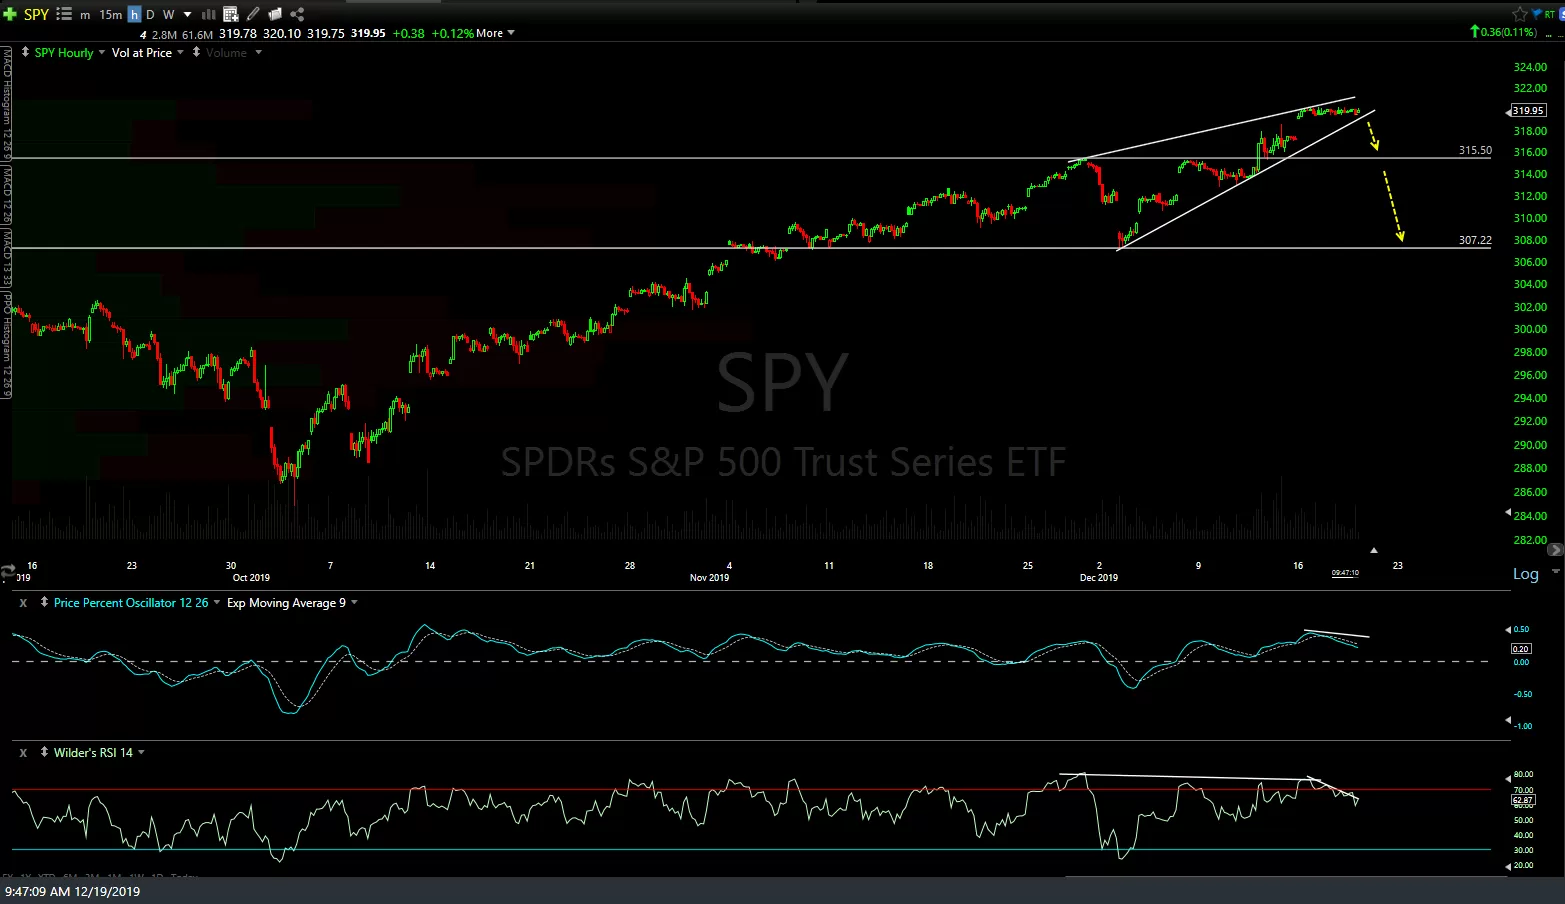
-
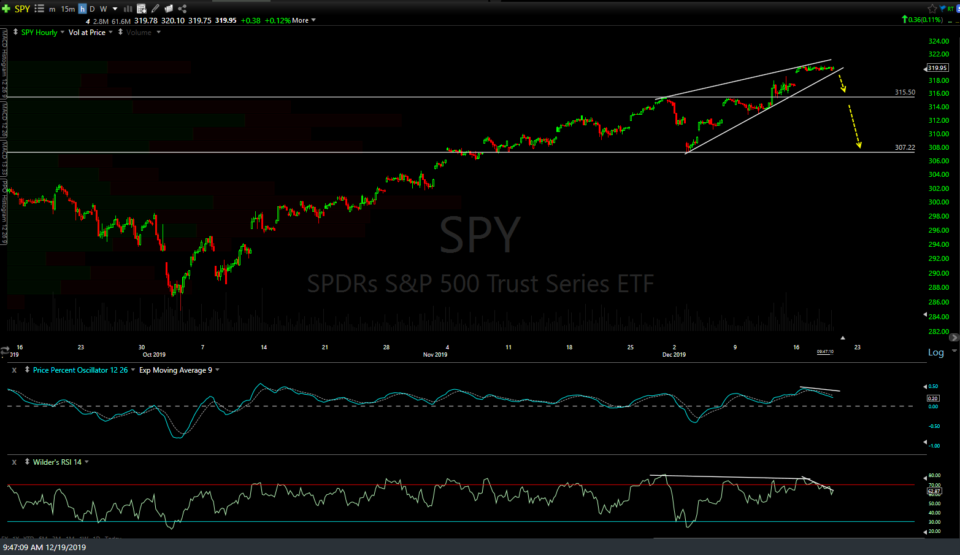
- SPY 60m Dec 19th
For those that prefer trading futures, we also have a nice & clean bearish rising wedge pattern on this 60-minute chart of /RTY (R2K small-cap futures) with an impulsive break and/or 60m close below to trigger an objective sell signal for a short trade targeting the 1640ish support zone. Another option is the Russell 2000 Micro E-mini futures, /M2K, which trade at the same price (and hence, the same charts) as /RTY but employ a smaller leverage factor by using a multiplier of 5 vs. 50. (/RTYor /M2k price X the multiplier = the amount of exposure to the index).

RTY 60m Dec 19th