
The price targets for the IWM Active Short Trade posted earlier today are currently T1 at 120.32, T2 at 119.09, T3 at 115.21 & T4 at 108.54. The suggested stop remains a daily close above 130.90 (edit: the original stop was incorrectly listed as well below the entry price and has been corrected) although those targeting T3 or T4 might opt to wait for a weekly close above that level.
IWM is currently backtesting the uptrend line off the February 2016 lows which also forms the bottom of a large bearish rising wedge pattern, similar to the bearish rising wedge pattern breakdown & backtest in mid-2015 that resulted in a 27% correction (from the late June peak to the Feb ’16 lows). The primary different being that the current wedge/uptrend line is much longer in duration as is the distance of the recent first counter-trend rally since the wedge breakdown that has brought prices up to backtest the wedge from below.
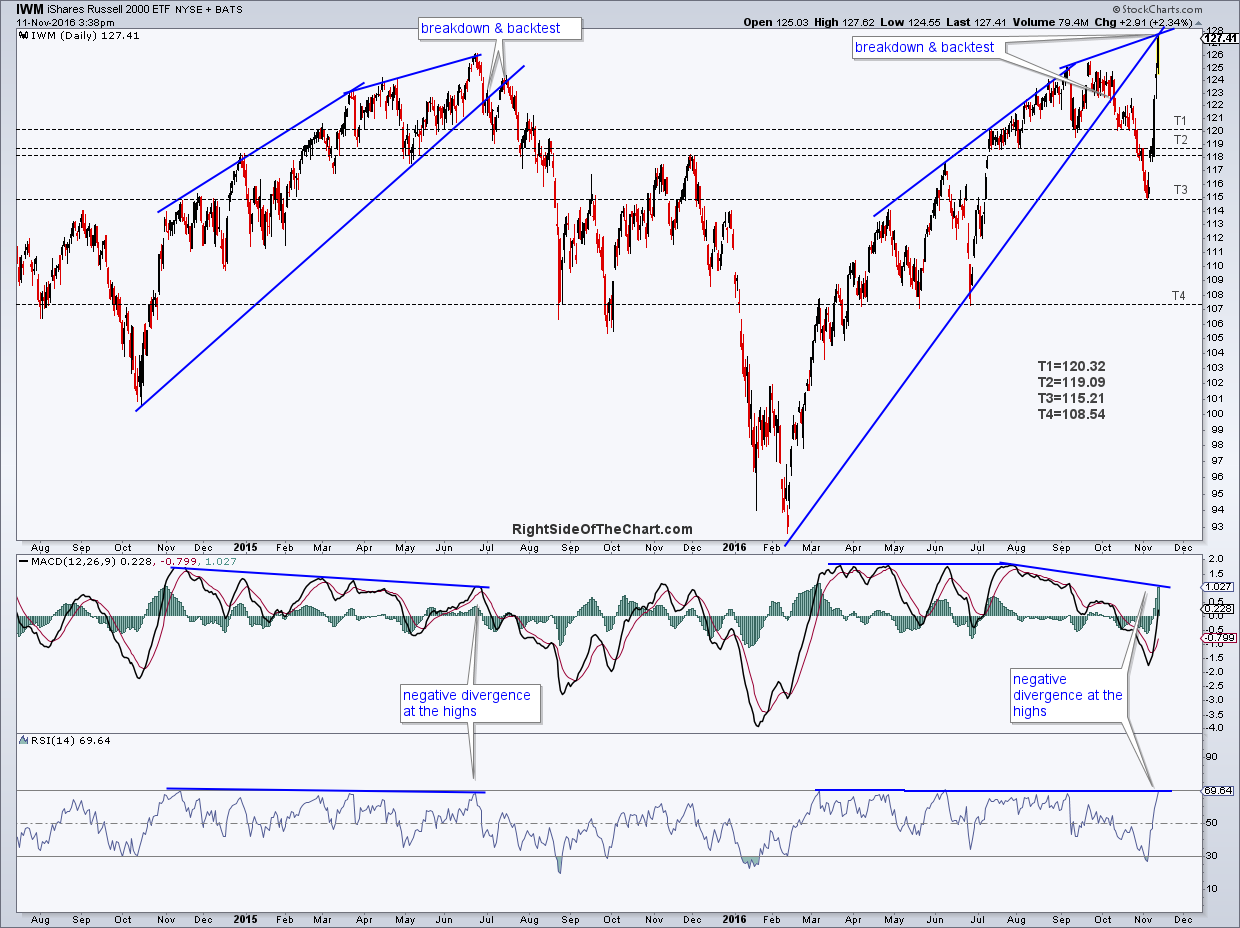
IWM daily Nov 11th
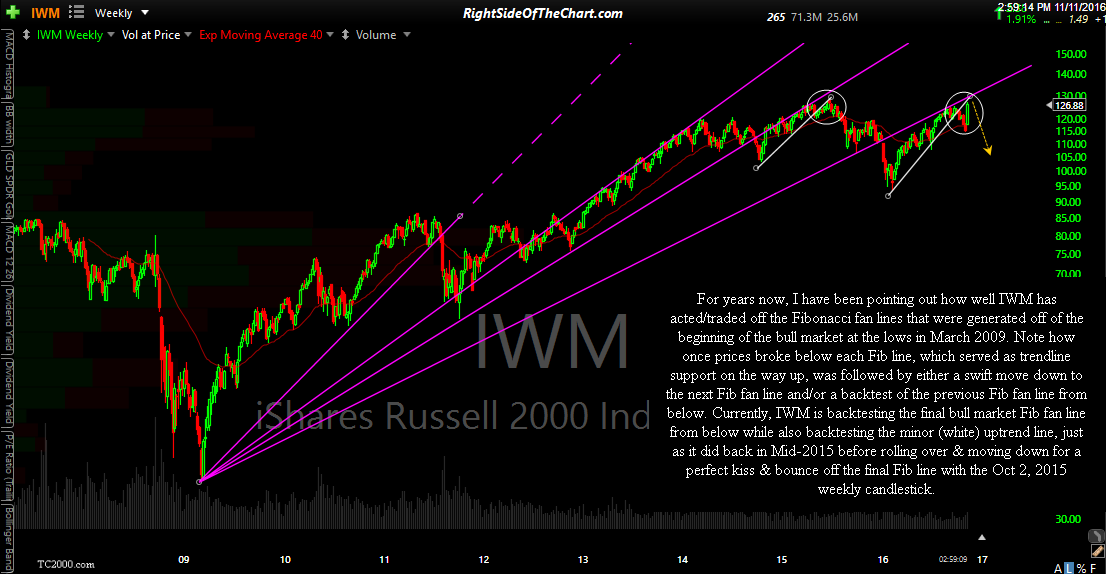
Zooming out the the weekly charts, the longer-term case for a short on IWM can be made from the following points. IWM currently:
- Challenging the April & June 2015 previous reaction highs
- Backtesting the final 2009-?? bull market Fibonacci fan line
- Backtesting the recently broken minor (yellow) uptrend line
- Coming off oversold levels with negative divergence on the weekly RSI, which as shown below (circles) has been followed by a significant correction, without a single exception over the last decade+
- Additional confirmation to the oversold readings/divergence on the RSI has been confirmed with bearish crossovers on the PPO (circles)

IWM weekly 1 Nov 11th
Finally, for years now, I have been pointing out how well IWM has acted/traded off the Fibonacci fan lines that were generated off of the beginning of the bull market at the lows in March 2009. Note how once prices broke below each Fib line, which served as trendline support on the way up, was followed by either a swift move down to the next Fib fan line and/or a backtest of the previous Fib fan line from below. Currently, IWM is backtesting the final bull market Fib fan line from below while also backtesting the minor (white) uptrend line, just as it did back in Mid-2015 before rolling over & moving down for a perfect kiss & bounce off the final Fib line with the Oct 2, 2015 weekly candlestick.
IWM weekly 2 Nov 11th